
The Nuclear Inevitability: AI Meets the Firm-Power Constraint
AI does not live in the cloud. It lives in substations, turbines, cooling loops, and power contracts.
The digital economy can scale software in weeks. The power system scales in years. That mismatch is turning electricity from a utility bill into a strategic constraint—and forcing technology companies to reconsider a source of firm generation that many had treated as politically obsolete.
This is the nuclear cascade: AI load growth → local grid congestion → demand for firm power → reactor life extensions and new builds → uranium and fuel-cycle pressure.
Nuclear is not the only answer. Storage, transmission, geothermal, natural gas with carbon management, efficiency, and demand flexibility all matter. But nuclear is one of the few proven technologies that can deliver large volumes of low-carbon electricity around the clock with a compact land footprint. That makes it increasingly difficult to exclude from any serious power plan.
The Load Arrives Before the Grid
The International Energy Agency estimates data centers consumed about 415 TWh in 2024, or 1.5% of global electricity. In its Base Case, consumption rises to roughly 945 TWh by 2030—just under 3% of global demand [1]. Accelerated servers account for almost half of the increase, with their electricity use growing about 30% annually.
That forecast is not destiny. The IEA also models higher-efficiency and slower-growth cases. The global share can look manageable while the local impact is severe: data centers cluster around specific substations and transmission corridors. In the United States, the IEA Base Case adds about 240 TWh of data-center demand between 2024 and 2030, a 130% increase [1].
A hyperscale operator can sign a renewable-energy contract quickly. It cannot summon transmission, long-duration storage, or firm generation on demand. Annual matching through renewable certificates is not the same as supplying every hour at the facility’s node. Wind and solar remain essential; the constraint is serving dense loads when weather, storage duration, and grid capacity do not cooperate.
Why the Atom Returns
Nuclear plants operate at high capacity factors and provide firm electricity without direct carbon emissions. Existing reactors can therefore become unusually valuable when a region needs both reliability and decarbonization.
The strongest near-term nuclear opportunity is not a fleet of unproven microreactors beside server farms. It is more prosaic: keeping sound reactors open, restarting selected assets, uprating capacity, securing long-term power contracts, and funding the fuel cycle.
Advanced reactors and small modular reactors may matter in the 2030s. The U.S. Department of Energy identifies real advantages for data-center loads, but also long licensing and construction timelines, first-of-a-kind cost, regulatory complexity, fuel constraints, and spent-fuel obligations [2]. More than half of SMR designs in development require HALEU, which is not yet widely available commercially [3].
The atom can solve a physical problem. It cannot escape execution risk.
The Fuel Cycle Remembers Fukushima
Following Fukushima in 2011, uranium entered a long bear market. Prices fell below the economics of much new production, mines closed, development slowed, and the industry lived partly on inventories and other secondary supply.
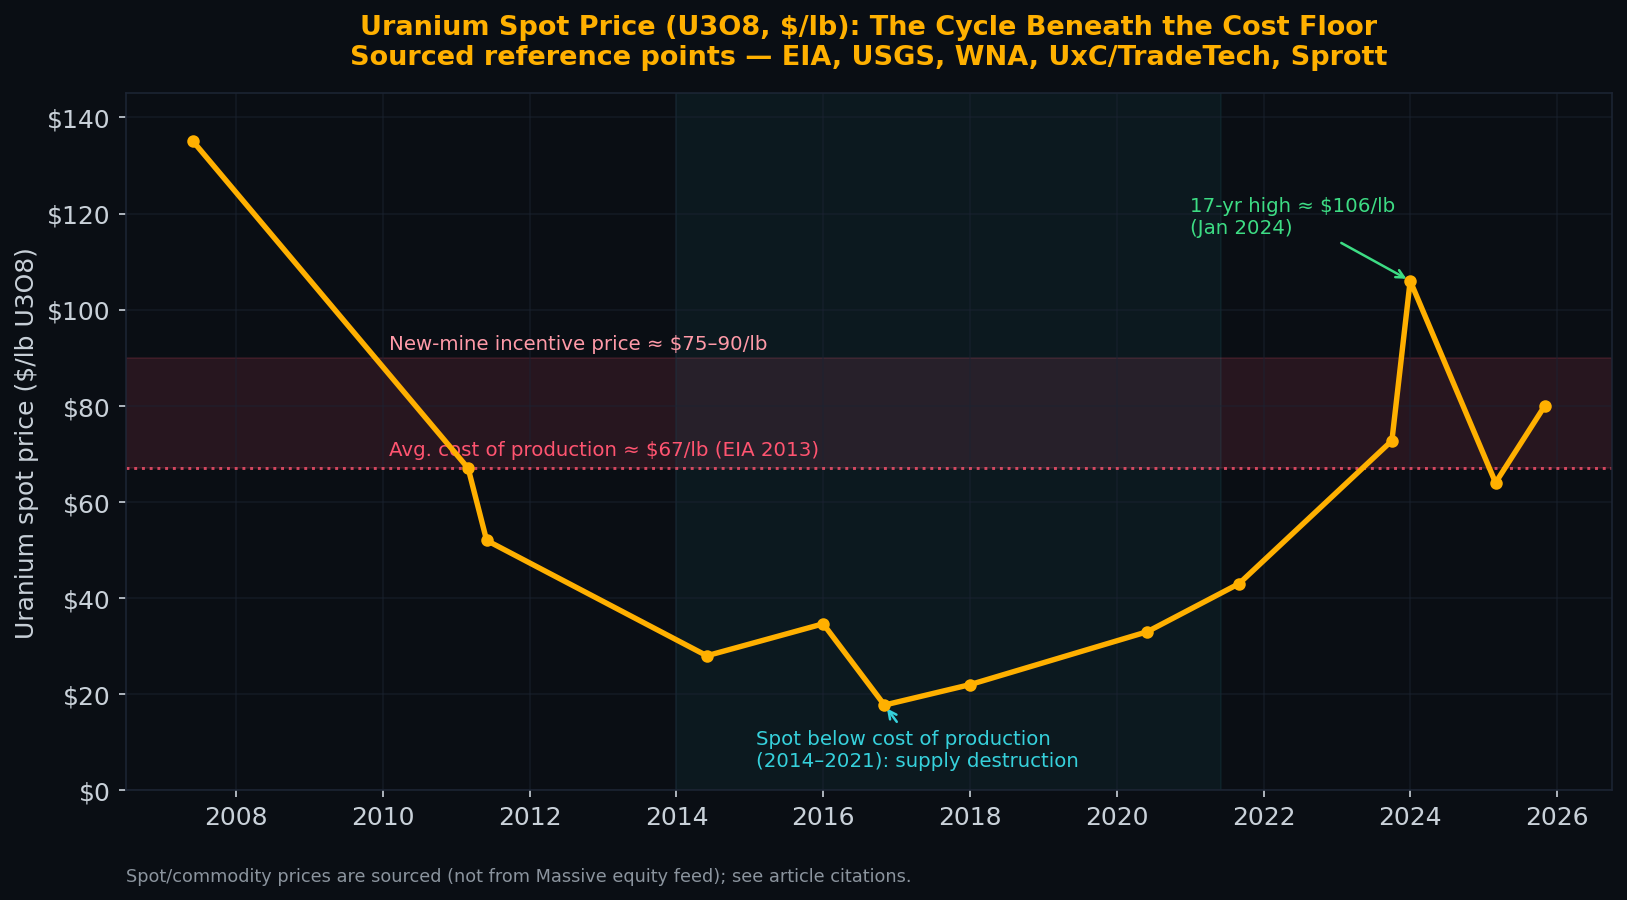
The price cycle destroyed investment before the present demand expansion. Historical spot prices are shown as market context, not a forecast.
The World Nuclear Association’s 2025 Reference Scenario estimates reactor requirements of 68,920 tonnes of uranium in 2025 and just over 150,000 tonnes by 2040 [4]. That path is one scenario among lower and upper cases, but it illustrates the scale of the fuel challenge if reactor construction and life extensions proceed.
Mine supply does not respond like semiconductor capacity. Permitting, community consent, geology, financing, conversion, enrichment, and geopolitical concentration all sit between a higher uranium price and fuel in a reactor. Inventories can bridge gaps. Restarts can add supply. Kazakhstan, Canada, and other producers can expand. But none of those responses is instantaneous.
The Exposure Map
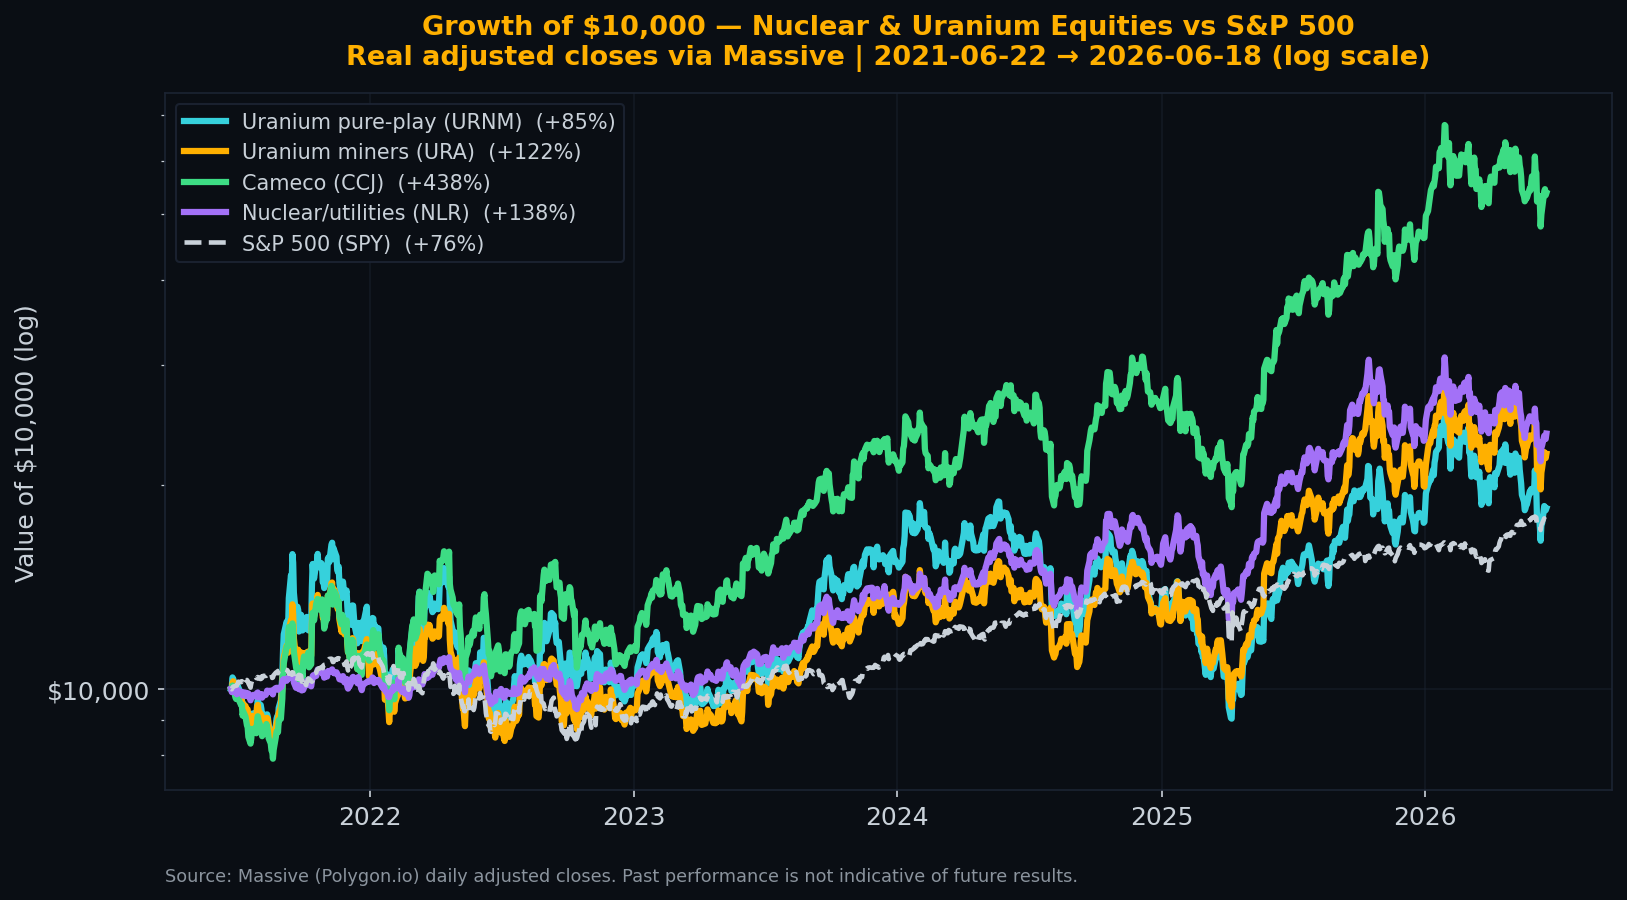
Adjusted-price performance through the chart’s stated cutoff. The sector’s large gains came with deep drawdowns; past performance is not evidence of future returns.
Cameco (CCJ) is the largest liquid Western uranium producer and a major fuel-services participant. That scale offers operating leverage to stronger contracting, but it also brings mine execution, tax, permitting, currency, customer-concentration, and geopolitical risks. Production does not increase automatically when the spot price rises.
Global X Uranium ETF (URA) is the broader basket. It held 57 securities in September 2026, spanning miners, physical uranium, and nuclear-component manufacturers; Cameco alone represented roughly 22% [5]. Breadth reduces single-mine risk but dilutes pure uranium exposure and does not eliminate sector concentration.
Sprott Uranium Miners ETF (URNM) is the sharper instrument. It held 25 securities, with about 82% in uranium-related equities and 18% in physical uranium at August 2026 [6]. Cameco, Sprott Physical Uranium Trust, and NexGen together represented nearly half the portfolio. Its 0.75% fee, smaller-company exposure, geopolitical concentration, and wider trading spread matter.
These are volatile commodity and policy vehicles, not bond substitutes. Uranium equities can fall 40% or more while the long-term reactor story remains intact. Entry price and position size can dominate a correct thesis.
The Counterforces
The nuclear case weakens if AI efficiency outruns compute growth, if grid buildout accelerates, or if storage and demand response cover more of the reliability gap than expected. Gas generation can win on speed and cost, particularly where carbon policy is weak. A reactor accident or construction overrun could reverse political support. Higher uranium prices can also revive mines, conservation, enrichment underfeeding, and secondary supply.
Those responses are how markets work. They do not make nuclear inevitable in every location.
The narrower claim is stronger: a system adding large, concentrated, 24-hour loads cannot rely on energy abundance in the abstract. It needs deliverable power at the right node and hour. When that requirement meets climate constraints and slow grid construction, firm low-carbon generation becomes more valuable.
AI may be written in code. Its boundary condition is still the power plant.
References
[1] International Energy Agency, Energy and AI — Energy demand from AI (2025)
[2] U.S. Department of Energy, “Advantages and Challenges of Nuclear-Powered Data Centers”
[3] World Nuclear Association, “Small Modular Nuclear Reactors”
[4] World Nuclear Association, World Nuclear Fuel Report 2025
[5] Global X, “Uranium ETF (URA)” — holdings and disclosures
[6] Sprott, “Sprott Uranium Miners ETF (URNM)” — holdings and disclosures
This article is for informational and educational purposes only. It is not investment advice, a recommendation, or an offer to buy or sell any security. The author may hold positions in securities discussed. See the site’s full Disclaimer & Securities Disclosure.
Liquidity & size of the names above
Data as of 2026-06-26 · Massive/Polygon, last ~30 trading days · figures move daily
Real figures from market data (2026-06-23 (last ~30 trading days)). Size tiers reflect median daily dollar volume — how easily a position can actually be entered or exited. This is reference data, not a recommendation.
Liquidity, in plain terms: how easily you can get in and out. Deep means you can trade freely without moving the price; Thin means even small orders can move it — mind the spread.
What this does not tell you — valuation. A real structural deficit does not mean the price hasn’t already discounted it. These figures show size and tradeability only; we deliberately do not screen for valuation, solvency, or whether a name is cheap or expensive today. Do your own valuation work.
| Ticker | Name | Type | Market cap | Median daily $ vol | Liquidity |
|---|---|---|---|---|---|
| URA | Global X Uranium ETFMost liquid uranium ETF, ER 0.69%, ~$6.6B AUM — but NOT pure uranium: ~25% industrials incl. reactor/SMR & components names, not just miners. | ETF | n/a · ETF | $191.1M | Deep |
| URNM | Sprott Uranium Miners ETFPurer uranium-miner exposure than URA (miners + physical uranium holdings), but lower liquidity and higher single-name concentration. | ETF | n/a · ETF | $37.2M | Liquid |
| CCJ | Cameco CorporationLargest Western uranium producer; also owns ~49% of Westinghouse (reactor services), so it is partly a nuclear-services play, not pure mined uranium. | Stock | $46.4B | $330.8M | Deep |
Tiers: Deep ≥ $100M/day · Liquid $20–100M · Moderate $3–20M · Thin $1–3M · < $1M = execution risk. The note under each name is a sourced exposure disclosure (how pure or diluted the play is), not a valuation view. Source: Massive/Polygon aggregates, last ~30 trading days (snapshot 2026-06-26). Figures move daily.
Found this useful? AtomProphet is independent and reader-funded — you can support the research & hosting ↓
Get the next cascade in your inbox
One short email when a new analysis drops — a single constraint traced end to end, from the physics to the chokepoint to the tickers, with the honest bear case kept in view. No marketing, no tracking, no noise.
- One email per published analysis — typically a few a month, never a daily blast
- The full cascade: driver → chokepoint → vetted, live-liquidity tickers
- The counter-case spelled out, not buried
No account, no paywall. Double opt-in, and one-click unsubscribe in every email.
Support the research & hosting
AtomProphet is independent, ad-light, and reader-funded. Contributions help cover data feeds, hosting, and the time behind the Cascade Graph — they keep this research free and open. A tip buys nothing, unlocks nothing, and is not payment for advice or for any security mentioned anywhere on this site.
Bitcoin37h98hpiHz6BW6ELvRLagk7BBo8UUtxeSh USDC · Base 0x1ac1Abe9eCAd5fAd8fF55B188E079b52cD1e6415