

The Framework
Begin with the core thesis: physics, scarcity, and geopolitical stress set the price of everything downstream.
Methodology & Sourcing
See how claims are graded, where data comes from, and how investable expressions are separated from narrative fluff.
Explore the Cascade Graph
Trace the mechanism chain from driver to chokepoint to terminal node and see where the pressure actually lands.
Prefer plain text or on a phone? Use the accessible Cascade Index.
One chain, four links, real tickers.
- 01
AI & electrification explode demand
Data centers, the grid, EVs and defense all need continuous power and physical metal — demand scaling at software speed.
- 02
The physical world can't keep up
Mines take ~17 years to build, ore grades are falling, and baseload power is finite. Supply is tethered to geology, not code.
- 03
Structural deficits form
A projected ~10 Mt copper gap by 2040 and a uranium shortfall after a “lost decade” of underinvestment. Physics sets the price.
- 04
Capital is forced to specific nodes
Copper: FCX, SCCO, COPX. Uranium: URA, URNM, CCJ. We show each name’s vetted exposure, real size & liquidity — and its honest drawdowns.
New here? A chokepoint is the narrow step everything else depends on; a cascade is how stress flows from one to the next; a terminal is the investable ticker at the end of the chain; a drawdown is the worst peak-to-trough fall you would have ridden out. Full glossary →
Every claim is graded and sourced; every ticker is reference, not advice. Read the full framework →
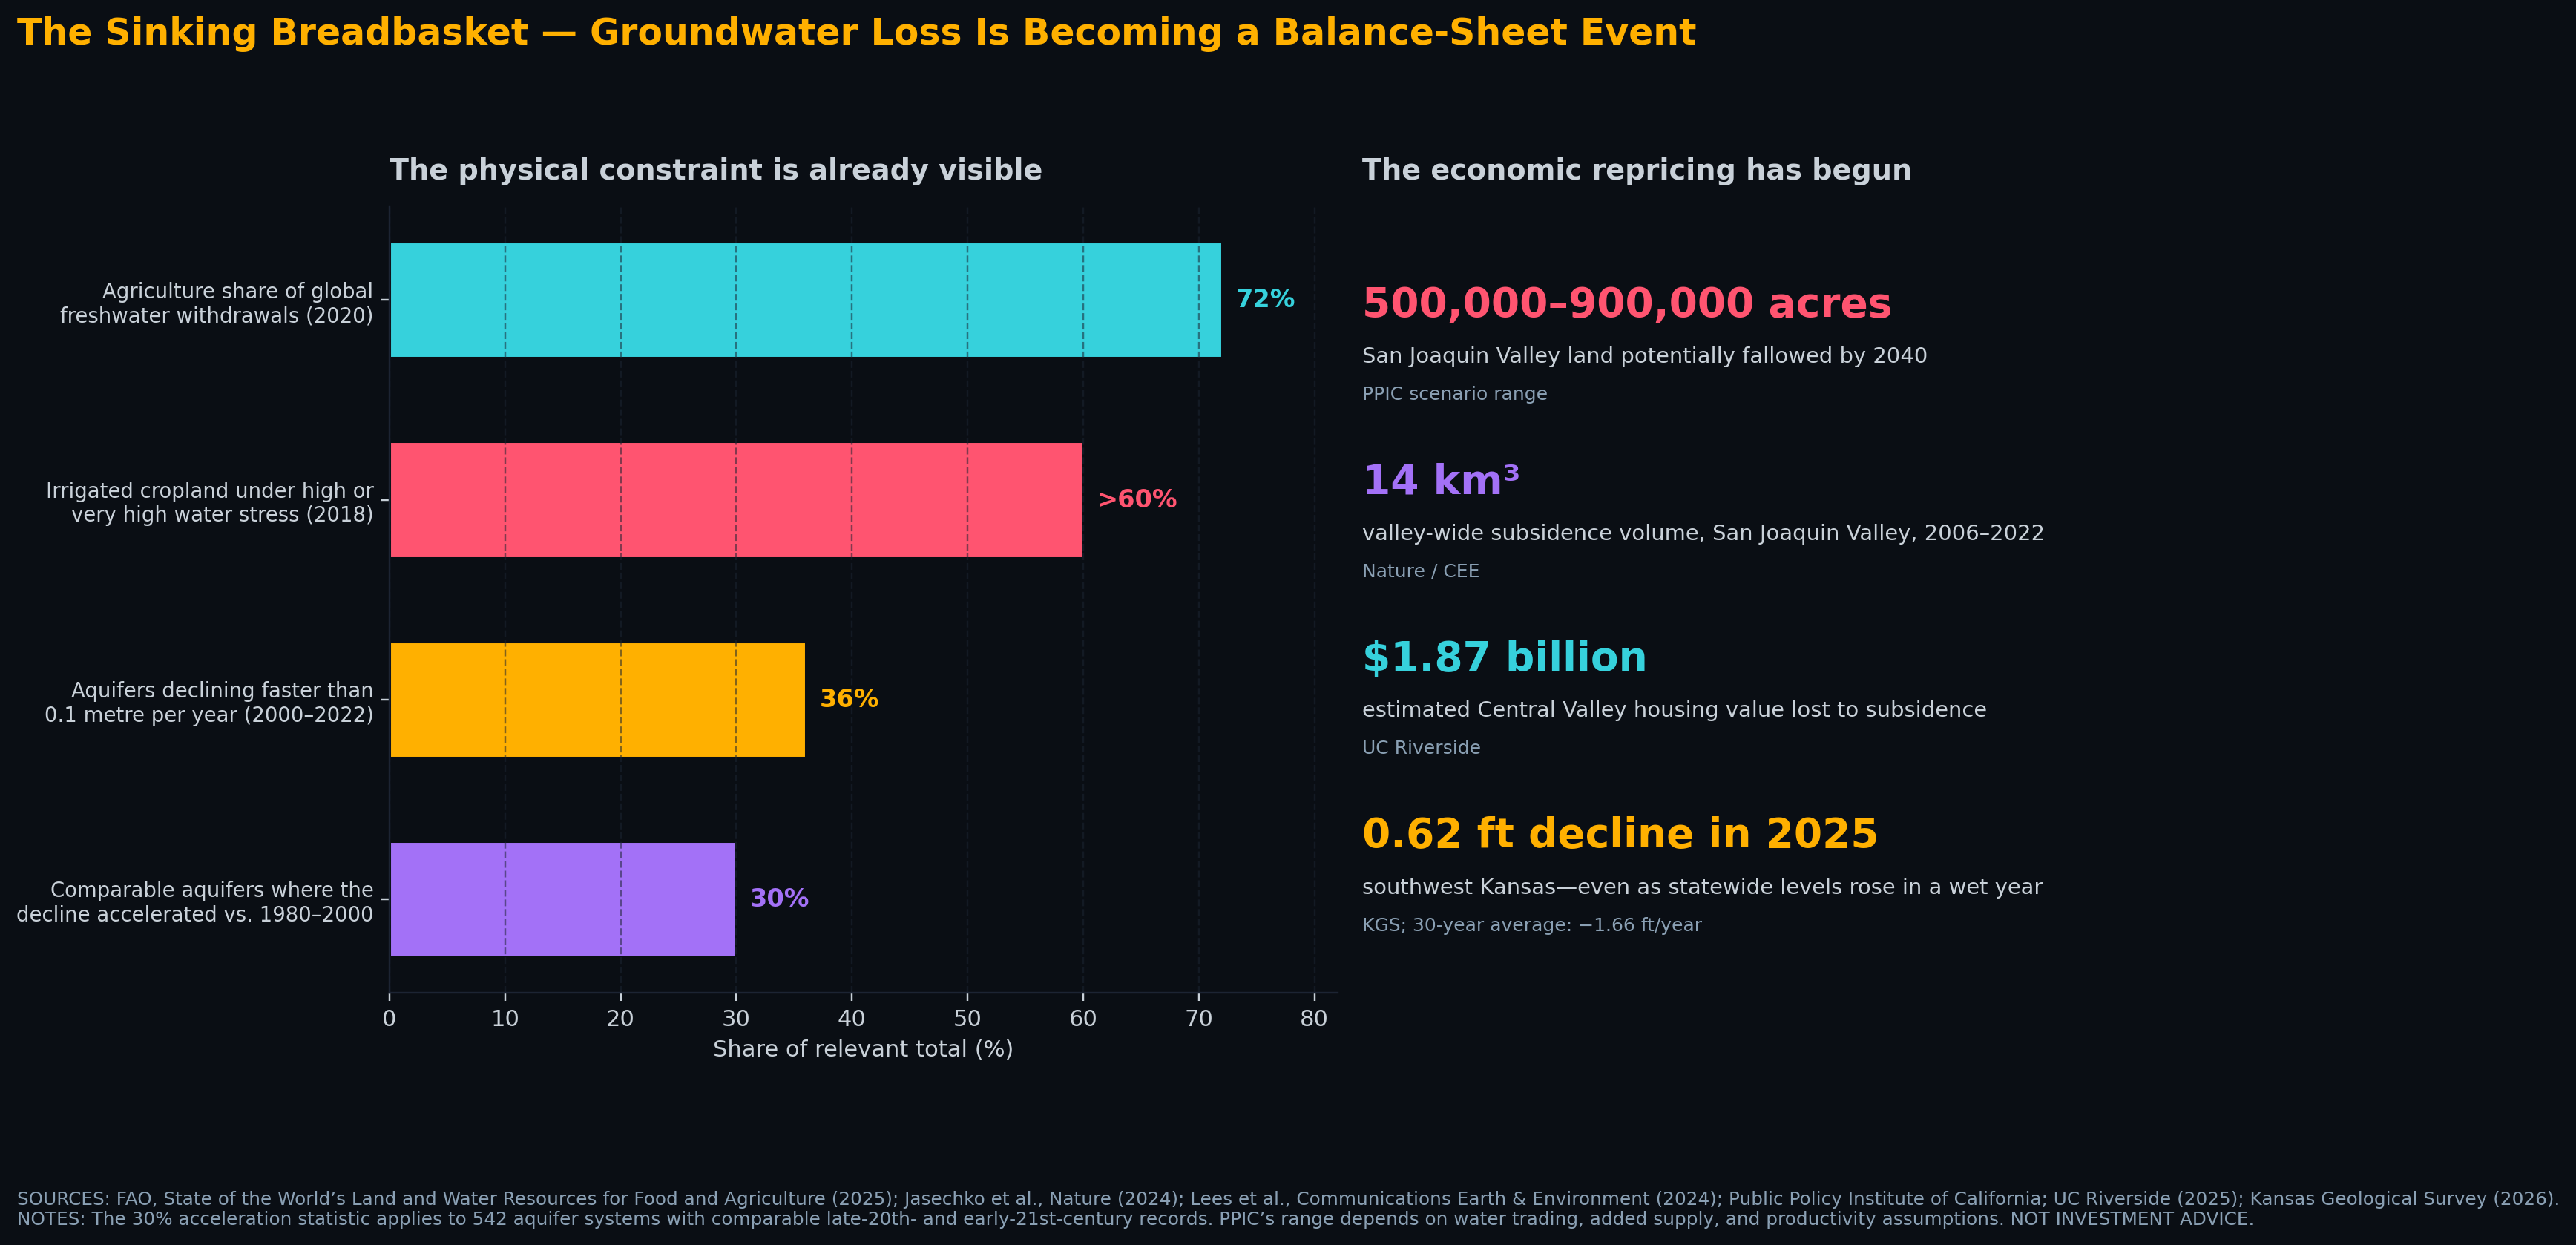
The Sinking Breadbasket (Water Series, Part 3)
Aquifers are falling, farmland is being repriced, and Colorado River scarcity has become federal allocation policy. The next agricultural constraint is beneath our feet.
The Cascade Graph
An interactive knowledge graph of the physical economy: 415 nodes, 627 mechanism edges, and 44 feedback loops, with evidence, honest grading, and plain-language causal links.
On a phone or using a screen reader? The same data is in the accessible Cascade Index — a structured, plain-text map of every node and ticker, no JavaScript required.
Transmissions
Each piece starts with a measurable constraint, follows the cascade through the real economy, and ends where capital is forced to react.
The Dry Mine (Water Series, Part 2)
Declining ore grades increase water and energy intensity just as major copper and lithium districts run into hydrological limits. The solution—seawater, pumping, and new technology—raises the cost curve.
The Thirsty Machine (Water Series, Part 1)
AI’s water problem is not a universal gallons-per-query statistic. It is a local collision among thermal density, cooling design, electricity, and the basins where data centers cluster.
The Uninsurable Future: When Risk Leaves the Balance Sheet
Physical losses are rising faster than traditional insurance can comfortably absorb. The risk does not disappear—it migrates into reinsurers, state pools, catastrophe bonds, and public balance sheets.
The Copper Chokepoint
Electrification has run into geology. Copper demand can move quickly; mines, smelters, grids, and water systems cannot. The resulting gap is a scenario—not a prophecy—but the response is already geopolitical.
The Nuclear Inevitability: AI Meets the Firm-Power Constraint
AI is turning electricity from an operating expense into a strategic input. Nuclear is not the only answer—but it is one of the few proven sources of firm, low-carbon power at scale.
The Northern Pivot: The Arctic Opens as the Politics Close
The Arctic’s physical corridor is opening while its political corridor is closing. The result is a strategic frontier with real infrastructure demand—and no clean public-market trade.
The Cascade Thesis: Economics Is Downstream of Physics
Markets price earnings one quarter at a time. Physical systems move through linked constraints. The Cascade Thesis is a framework for following those constraints before they reach the income statement.
Get the next cascade in your inbox
One short email when a new analysis drops — a single constraint traced end to end, from the physics to the chokepoint to the tickers, with the honest bear case kept in view. No marketing, no tracking, no noise.
- One email per published analysis — typically a few a month, never a daily blast
- The full cascade: driver → chokepoint → vetted, live-liquidity tickers
- The counter-case spelled out, not buried
No account, no paywall. Double opt-in, and one-click unsubscribe in every email.
Support the research & hosting
AtomProphet is independent, ad-light, and reader-funded. Contributions help cover data feeds, hosting, and the time behind the Cascade Graph — they keep this research free and open. A tip buys nothing, unlocks nothing, and is not payment for advice or for any security mentioned anywhere on this site.
Bitcoin37h98hpiHz6BW6ELvRLagk7BBo8UUtxeSh USDC · Base 0x1ac1Abe9eCAd5fAd8fF55B188E079b52cD1e6415