
The Sinking Breadbasket (Water Series, Part 3)
In Part 1, we mapped the collision between freshwater and AI compute. In Part 2, we followed the same constraint into copper and lithium. But the largest claimant was there long before either industry arrived: agriculture accounts for 72% of global freshwater withdrawals [1].
For decades, the world buffered drought by treating underground aquifers like an infinite checking account. The balance is now coming due.
A landmark Nature study assembled measurements from roughly 170,000 wells across 1,693 aquifer systems. During 2000–2022, groundwater levels fell faster than 0.1 metre per year in 36% of those systems. Among the 542 aquifers with comparable late-20th-century records, the decline accelerated in 30% [2].
This is not a distant model. It is a physical contraction in the resource base beneath the global food system.
When the Ground Becomes the Ledger
Aquifer depletion does more than empty wells. When pumping depressurizes clay-rich sediments, the ground compacts. Where that compaction destroys pore space, part of the aquifer’s storage capacity is lost for good.
California’s San Joaquin Valley offers the clearest balance sheet. Satellite analysis measured roughly 14 cubic kilometres of subsidence between 2006 and 2022 [3]. The damage is not abstract: sinking ground reduces canal capacity, stresses roads and pipelines, and shifts value between properties with secure surface water and those dependent on pumping.
A 2025 UC Riverside study estimated that groundwater depletion and subsidence erased $1.87 billion from Central Valley housing values—an average loss of $6,689 to $16,165 for affected homes [4]. Water scarcity had crossed from hydrology into collateral.
The High Plains tells the same story with an important warning against straight-line narratives. After five consecutive years of decline, heavy 2025 rainfall helped Kansas High Plains groundwater rise about 0.2 feet overall. Yet southwest Kansas still fell 0.62 feet, and its 30-year average decline remained 1.66 feet per year [5]. A wet year can reduce pumping and produce a temporary bounce. It does not refill a mined aquifer.
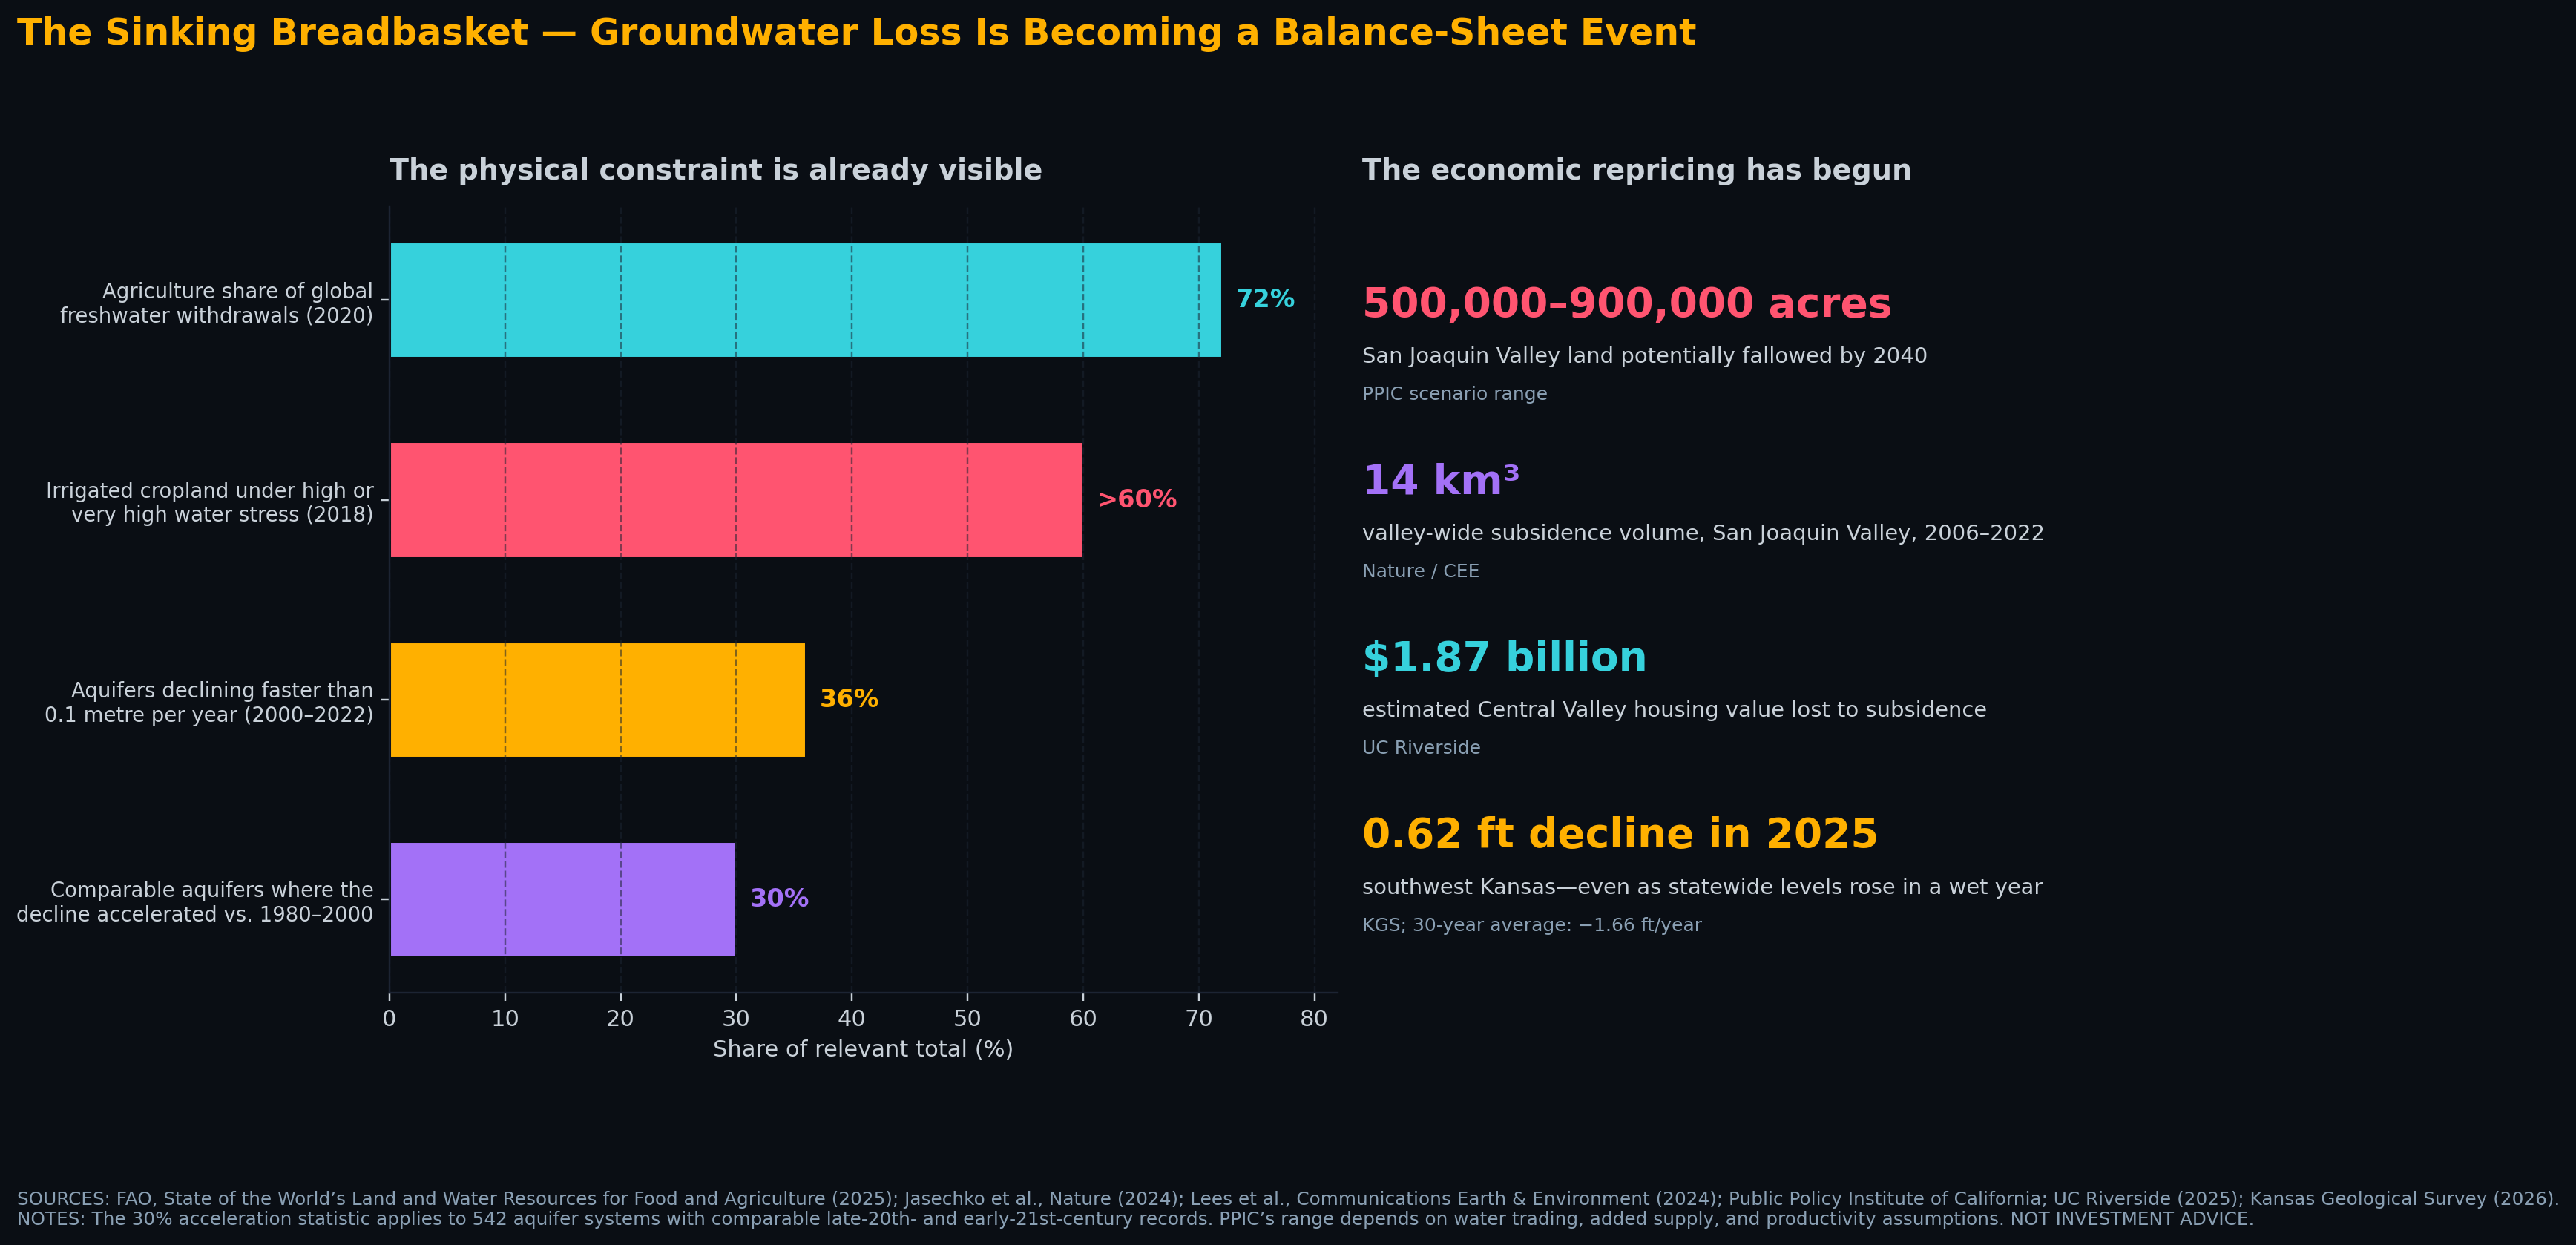 The physical constraint is measurable; the economic repricing has already begun. Sources and methodological caveats appear in the figure.
From Hydrology to Allocation
Physics eventually forces policy.
California’s Sustainable Groundwater Management Act requires critically overdrafted basins to reach long-term balance by the early 2040s. The Public Policy Institute of California estimates that 500,000 to 900,000 acres of San Joaquin Valley farmland may leave production by 2040, depending on water trading, productivity, and how much new supply can be developed [6]. That is a scenario range, not destiny—but every path to a smaller number demands capital, coordination, and much higher water productivity.
The same transition is now visible on the Colorado River. On August 21, 2026, the Department of the Interior finalized operating guidelines requiring 1.25 million acre-feet of annual Lower Basin delivery reductions in both 2027 and 2028. Under the states’ proposed sharing agreement, Arizona would absorb 760,000 acre-feet, California 440,000, and Nevada 50,000. The Lower Basin must also conserve and store at least 700,000 additional acre-feet over the two-year period [7].
Lake Mead and Lake Powell both reached record-low elevations in August. Their combined contents were the lowest since before Lake Powell began filling in 1963. The new rules are a two-year bridge, not a permanent settlement. But they mark a decisive change: water scarcity has moved from forecast to allocation.
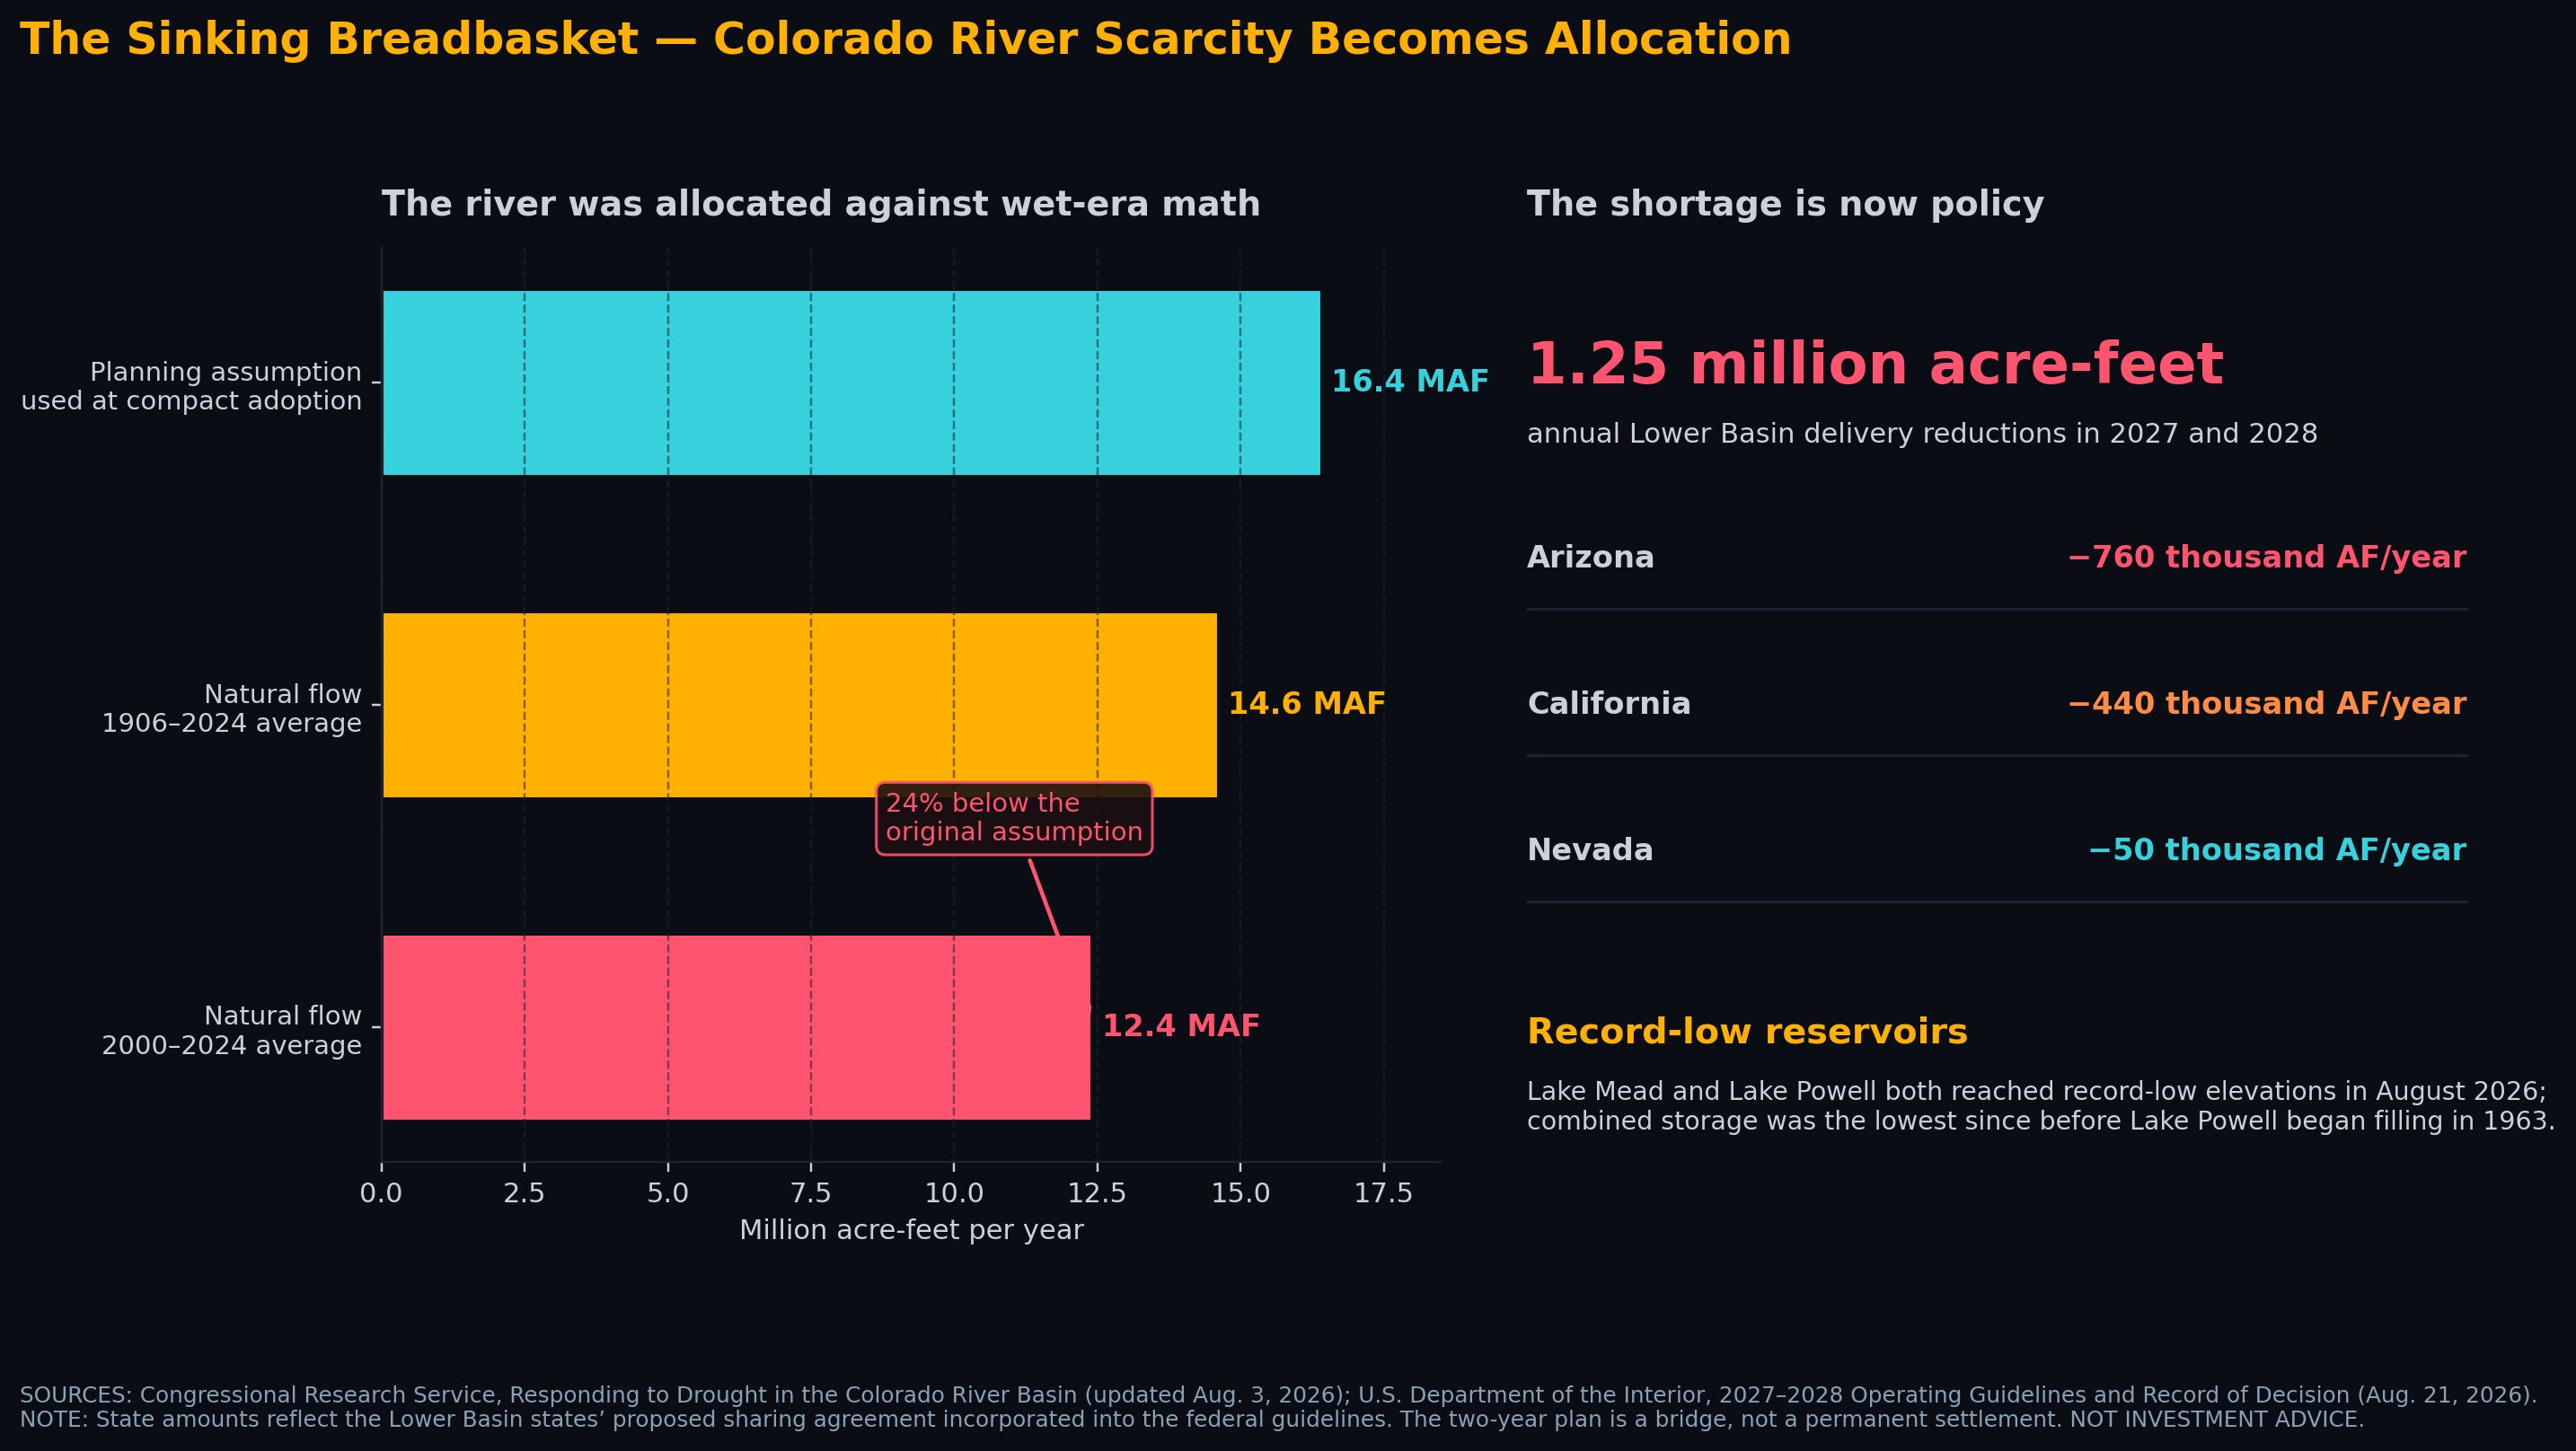 The river was allocated against wet-era math. The shortage is now policy. Sources and assumptions appear in the figure.
The Cascade
As water tables fall, pumping gets more energy-intensive. As deliveries are cut, farms must spend more on storage, conveyance, sensing, and irrigation efficiency—or retire acreage. Cities answer scarcity with recycling, desalination, and longer pipelines. Those systems demand electricity, grid infrastructure, and copper. Copper production itself consumes water.
The loop is brutally simple:
Water scarcity raises energy demand. Energy infrastructure raises metals demand. Metals production raises water demand.
There is no clean escape—only efficiency, substitution, and repricing.
The Investable Cascade
This is a map of exposure, not a list of recommendations.
1. The signal: water rights repricing. The Nasdaq Veles California Water Index (NQH2O) tracks water-rights leases and sales across five actively traded California markets. CME lists futures against it, but those are specialist hedging instruments—not a clean equity vehicle for most investors. The index matters because it makes scarcity legible as a price.
2. Precision agriculture: Deere (DE) and AGCO (AGCO). Deere’s Production & Precision Agriculture segment and AGCO’s PTx platform sell guidance, telemetry, sensing, application control, and mixed-fleet automation. Those tools can help farmers produce more with less water, fertilizer, fuel, and labor [8]. But neither company is a water pure play. Both remain capital-equipment cyclicals exposed to crop prices, farm income, interest rates, dealer inventories, tariffs, and delayed replacement cycles. AGCO reported 2025 net sales down 13.5%, partly because of softer demand and a business divestiture. A sound scarcity thesis can still be a badly timed stock trade.
3. Broad agribusiness: VanEck Agribusiness ETF (MOO). MOO spreads exposure across seeds, fertilizer, machinery, animal health, cultivation, and agricultural-product trading. That diversification reduces single-company risk, but it also dilutes the groundwater thesis. Some holdings benefit from higher agricultural investment; others can be squeezed by the same input inflation and crop-price volatility. Its 0.56% expense ratio and foreign-market exposure matter. It is an agribusiness basket—not a direct bet on water or food prices.
What Could Break the Thesis?
A sustained run of wet years can reduce pumping and temporarily stabilize shallow systems, as Kansas demonstrated in 2025. Water trading, new storage, recycling, and more efficient conveyance could reduce the acreage that California must idle. Drought-tolerant crops, deficit irrigation, and precision application can raise output per drop. Cheap power could improve the economics of desalination and water transport.
Those are real counterforces. They are also capital-intensive responses to the same constraint.
The near-term investment risk is simpler: low grain prices or expensive credit can suppress farm-equipment spending even while water scarcity worsens. DE, AGCO, and MOO can fall for reasons the aquifer thesis does not address. The physical signal may be early; the equity signal can remain cyclical.
Markets know how to price a failed harvest. They are far less practiced at pricing the aquifer beneath it. By the time the water table becomes the headline, the balance sheet has already moved.
References
[8] Primary exposure disclosures: Deere FY2026 Form 10-Q, AGCO 2025 Form 10-K, and VanEck MOO fund page
This article is for informational and educational purposes only. It is not investment advice, a recommendation, or an offer to buy or sell any security. The author may hold positions in securities discussed. See the site’s full Disclaimer & Securities Disclosure.
Liquidity & size of the names above
Data as of 2026-06-26 · Massive/Polygon, last ~30 trading days · figures move daily
Real figures from market data (2026-06-23 (last ~30 trading days)). Size tiers reflect median daily dollar volume — how easily a position can actually be entered or exited. This is reference data, not a recommendation.
Liquidity, in plain terms: how easily you can get in and out. Deep means you can trade freely without moving the price; Thin means even small orders can move it — mind the spread.
What this does not tell you — valuation. A real structural deficit does not mean the price hasn’t already discounted it. These figures show size and tradeability only; we deliberately do not screen for valuation, solvency, or whether a name is cheap or expensive today. Do your own valuation work.
| Ticker | Name | Type | Market cap | Median daily $ vol | Liquidity |
|---|---|---|---|---|---|
| MOO | VanEck Agribusiness ETFDiversified agribusiness (equipment, fertilizer, seeds, processors); the low-effort way to own the northern-cropland leg. | ETF | n/a · ETF | $18.0M | Moderate |
| DE | Deere & CompanyDominant farm-equipment maker; direct leverage to expanding northern arable acreage. Cyclical to ag capex, not a pure 'Arctic' name. | Stock | $159.1B | $748.1M | Deep |
| AGCO | AGCO CorporationPure-play global farm-equipment maker (Fendt, Massey Ferguson); smaller, cleaner ag-equipment bet than Deere; more cyclical. | Stock | $8.2B | $72.7M | Liquid |
Tiers: Deep ≥ $100M/day · Liquid $20–100M · Moderate $3–20M · Thin $1–3M · < $1M = execution risk. The note under each name is a sourced exposure disclosure (how pure or diluted the play is), not a valuation view. Source: Massive/Polygon aggregates, last ~30 trading days (snapshot 2026-06-26). Figures move daily.
Found this useful? AtomProphet is independent and reader-funded — you can support the research & hosting ↓
Get the next cascade in your inbox
One short email when a new analysis drops — a single constraint traced end to end, from the physics to the chokepoint to the tickers, with the honest bear case kept in view. No marketing, no tracking, no noise.
- One email per published analysis — typically a few a month, never a daily blast
- The full cascade: driver → chokepoint → vetted, live-liquidity tickers
- The counter-case spelled out, not buried
No account, no paywall. Double opt-in, and one-click unsubscribe in every email.
Support the research & hosting
AtomProphet is independent, ad-light, and reader-funded. Contributions help cover data feeds, hosting, and the time behind the Cascade Graph — they keep this research free and open. A tip buys nothing, unlocks nothing, and is not payment for advice or for any security mentioned anywhere on this site.
Bitcoin37h98hpiHz6BW6ELvRLagk7BBo8UUtxeSh USDC · Base 0x1ac1Abe9eCAd5fAd8fF55B188E079b52cD1e6415