
The Dry Mine (Water Series, Part 2)
The energy transition is digging deeper for poorer rock in drier places.
Copper and lithium are often described as geological constraints. They are also hydrological systems. Ore must be crushed, separated, concentrated, transported, and managed as tailings. Brines must be pumped and processed. As grades fall, more material moves for each unit of metal—and the water and energy ledger grows.
This is Part 2 of the Water Nexus: declining resource quality → higher water intensity → desalination and pumping → higher power demand → more grid and copper demand.
The mine needs water. The solution needs energy. The energy system needs the mine.
The Constraint Is Real—and Definitions Matter
The World Resources Institute finds at least 16% of mapped land-based critical-mineral mines, deposits, and districts in areas of high or extremely high baseline water stress, rising to 20% by 2050 in its business-as-usual scenario [1]. The underlying dataset excludes copper and is more complete in the United States, so the percentage should not be generalized beyond its scope.
A separate IEA analysis found more than half of then-current lithium production and roughly 80% of Chilean copper output in high-water-stress or arid areas [2]. The vintage and boundaries differ, but the direction is consistent: strategic minerals are concentrated where water is operationally and politically scarce.
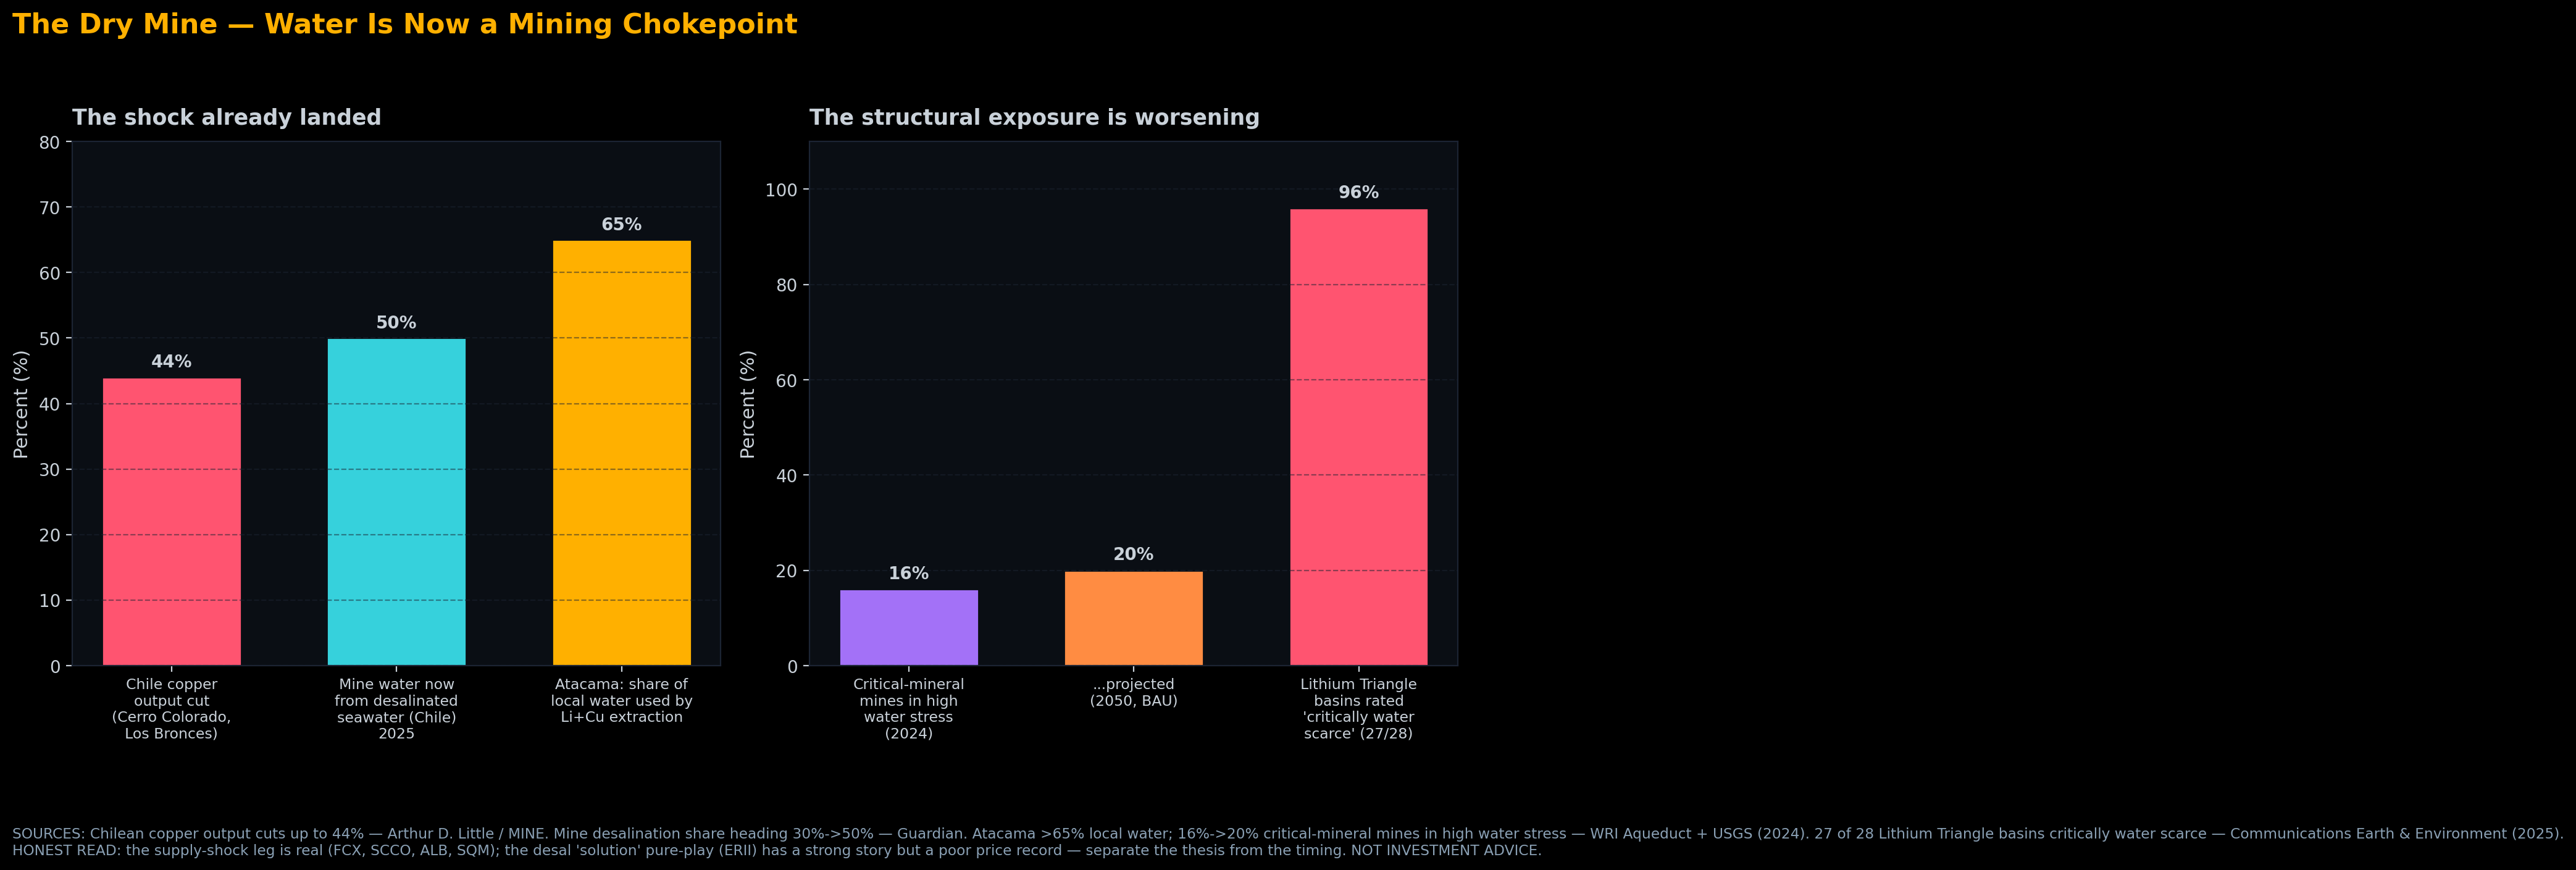
The chart separates observed conditions from projected responses. Water stress is a cost and execution variable, not a one-number forecast.
Copper: More Rock, More Water, More Power
The IEA reports average global copper-mine grade has fallen roughly 40% since 1991 [3]. Lower grades require more crushing and processing for the same metal output. That raises energy use and often water demand, while expanding tailings and infrastructure needs.
Chile sits at the center of the collision. It is a major copper producer with mines in some of the driest terrain on Earth. Water constraints have affected permitting, operations, and expansion decisions. But the exact mechanism matters: a temporary throughput cut, a groundwater restriction, and a long-term seawater investment are not interchangeable.
The robust conclusion is narrower than “Chile is out of water.” New and expanded mines increasingly require expensive water strategies, while existing assets face local hydrology, community claims, and regulation.
Lithium: Brine Is Not Freshwater
Lithium-brine discussions often call every litre pumped “water.” That obscures the environmental question.
WRI cites brine withdrawal of up to roughly 500,000 gallons per tonne of lithium in some operations [1]. Brine is not potable freshwater. Pumping it can still alter pressure, flow, salinity, wetlands, and freshwater–brine interactions, which is why definitions and basin-specific hydrogeology matter.
A 2025 Communications Earth & Environment study examined 28 active or prospective Lithium Triangle basins and estimated modern freshwater inflows of only 2–33 millimetres per year. It also found that global hydrological models substantially overestimated local freshwater availability [4]. The paper does not establish that 27 of 28 basins share one universal “critical scarcity” classification.
Direct lithium extraction is not automatically the low-water escape hatch. In the same study’s literature synthesis, 33% of assessed DLE technologies consumed less freshwater than evaporation, 11% were similar, 25% used more, and 31% used more than ten times as much [4]. Chemistry, reinjection, heat, reagents, recovery, and system boundaries determine the outcome.
The technology must be measured project by project.
The Seawater Response
Chile’s copper industry is shifting toward desalinated and direct seawater because continental freshwater is constrained. Cochilco projects seawater’s share of large-scale copper-mining water consumption rising from 41% in 2024 to 68% in 2034, while freshwater use falls from 10.9 to 6.7 cubic metres per second [5].
This is an industry trajectory shaped by permits, economics, and local conditions—not a universal law requiring every mine to desalinate.
The water may come from the Pacific. The mine is often hundreds of kilometres inland and thousands of metres above sea level. Reverse osmosis, long pipelines, and elevation pumping move the bottleneck from water availability into capital and electricity.
Cochilco’s model estimates average cost of roughly $4.45 per cubic metre for desalination plus pumping, versus $1.87 for direct seawater pumping [5]. The ocean expands supply. Gravity sends the bill.
The feedback loop is now visible:
Lower ore grades increase water and energy intensity. Seawater infrastructure increases power and copper demand. The grid built to serve the mine requires more copper.
The Exposure Map
Copper majors — Freeport-McMoRan (FCX) and Southern Copper (SCCO). Existing, permitted, long-life assets can become more valuable when new supply is expensive. Both remain cyclical operators with political, social, permitting, labor, energy, and capital risk. FCX discloses water-right litigation affecting Arizona operations [6]. SCCO describes water as an operational input and invests in recovery, while stating that current sources are sufficient [7]. Water is one factor, not a one-way earnings catalyst.
Desalination efficiency — Energy Recovery (ERII). ERII’s pressure exchangers reduce energy use in seawater reverse osmosis. Its core exposure is real and concentrated. Project timing, customer geography, competition, and adoption outside desalination can produce volatile results [8]. A technology can be essential to a process without producing smooth revenue or a cheap stock.
Lithium producers — Albemarle (ALB) and SQM (SQM). Both control strategic conversion and resource positions, and both face the opposite of a simple scarcity trade. Lithium prices fell sharply from 2023 highs, driving restructuring, project deferrals, and earnings pressure. ALB identifies water rights and use in Chile as material risks [9]. SQM reports Salar de Atacama lithium prices declining from $30,467 per tonne in 2023 to $9,174 in 2025, alongside regulatory, brine-reserve, partnership, energy, and demand risk [10].
DLE may improve recovery or reduce some impacts. It may also add heat, power, reagents, and freshwater demand. Neither company should be treated as a clean water-efficiency vehicle.
What Could Break the Thesis?
Higher metal prices can fund desalination, recycling, substitution, and new supply. Dry-stack tailings, water reuse, ore sorting, and process redesign can reduce withdrawals. Copper demand can disappoint. Lithium oversupply can persist. Communities and regulators can block projects regardless of price.
The physical constraint does not guarantee equity returns. It raises the cost and complexity of the response.
The energy transition is ultimately a materials transition. And that materials transition is bottlenecked by the same resource that dictated where every civilization in human history chose to build—and where it chose to die.
Water Nexus: Part 1 — The Thirsty Machine · Part 3 — The Sinking Breadbasket
References
[1] World Resources Institute, “How Critical Minerals Mining Affects Water”
[5] InvestChile summary of Cochilco, “Water used in large-scale mining” (2026)
[6] Freeport-McMoRan, SEC filings
[7] Southern Copper Corporation, SEC filings
[8] Energy Recovery, SEC filings
[10] Sociedad Química y Minera de Chile, SEC filings
This article is for informational and educational purposes only. It is not investment advice, a recommendation, or an offer to buy or sell any security. The author may hold positions in securities discussed. See the site’s full Disclaimer & Securities Disclosure.
Liquidity & size of the names above
Data as of 2026-06-26 · Massive/Polygon, last ~30 trading days · figures move daily
Real figures from market data (2026-06-23 (last ~30 trading days)). Size tiers reflect median daily dollar volume — how easily a position can actually be entered or exited. This is reference data, not a recommendation.
Liquidity, in plain terms: how easily you can get in and out. Deep means you can trade freely without moving the price; Thin means even small orders can move it — mind the spread.
What this does not tell you — valuation. A real structural deficit does not mean the price hasn’t already discounted it. These figures show size and tradeability only; we deliberately do not screen for valuation, solvency, or whether a name is cheap or expensive today. Do your own valuation work.
| Ticker | Name | Type | Market cap | Median daily $ vol | Liquidity |
|---|---|---|---|---|---|
| FCX | Freeport-McMoran Inc.~80% of revenue is copper; gold (Grasberg) and molybdenum are byproducts. Largest US-listed copper pure-ish play. | Stock | $98.7B | $879.0M | Deep |
| SCCO | Southern Copper CorporationOne of the purest copper majors (Peru/Mexico), but ~88% owned by Grupo México — low free float, controlled-company governance risk. | Stock | $161.0B | $248.4M | Deep |
Tiers: Deep ≥ $100M/day · Liquid $20–100M · Moderate $3–20M · Thin $1–3M · < $1M = execution risk. The note under each name is a sourced exposure disclosure (how pure or diluted the play is), not a valuation view. Source: Massive/Polygon aggregates, last ~30 trading days (snapshot 2026-06-26). Figures move daily.
Found this useful? AtomProphet is independent and reader-funded — you can support the research & hosting ↓
Get the next cascade in your inbox
One short email when a new analysis drops — a single constraint traced end to end, from the physics to the chokepoint to the tickers, with the honest bear case kept in view. No marketing, no tracking, no noise.
- One email per published analysis — typically a few a month, never a daily blast
- The full cascade: driver → chokepoint → vetted, live-liquidity tickers
- The counter-case spelled out, not buried
No account, no paywall. Double opt-in, and one-click unsubscribe in every email.
Support the research & hosting
AtomProphet is independent, ad-light, and reader-funded. Contributions help cover data feeds, hosting, and the time behind the Cascade Graph — they keep this research free and open. A tip buys nothing, unlocks nothing, and is not payment for advice or for any security mentioned anywhere on this site.
Bitcoin37h98hpiHz6BW6ELvRLagk7BBo8UUtxeSh USDC · Base 0x1ac1Abe9eCAd5fAd8fF55B188E079b52cD1e6415