
The Thirsty Machine (Water Series, Part 1)
AI does not drink water. Its infrastructure does.
Servers turn electricity into heat. That heat must leave the rack, the building, and ultimately the local environment. Water is often the most efficient carrier in that chain—but the amount consumed depends on cooling design, climate, workload, electricity source, and the final method of heat rejection.
That complexity is the point. The AI-water collision is not a universal “gallons per query” fact. It is a siting and systems problem: dense computing loads are clustering in places where grids and watersheds already have little slack.
This is Part 1 of the Water Nexus.
Three Water Footprints, Not One
A data center’s water footprint has at least three layers [1]:
- Direct cooling: water used at the facility, often through evaporative towers.
- Indirect electricity: water withdrawn or consumed by the generation supplying the site.
- Supply chain: water embedded in semiconductors, equipment, construction, and materials.
The Congressional Research Service estimates direct U.S. data-center water use rose from about 5.6 billion gallons in 2014 to roughly 17 billion gallons in 2023 [2]. It estimates that a 100 MW U.S. facility may directly consume water comparable to about 2,600 households when averaged across cooling strategies.
Those are national-scale benchmarks, not a template for every site. A peer-reviewed 2026 review found direct evaporative cooling can range from roughly 1 to 9 litres per kWh of server energy, depending on technology and climate [1]. Per-query estimates are even more conditional: model size, hardware, utilization, location, weather, and grid mix can move the result dramatically.
Nationally, agriculture remains far larger. Locally, a new industrial load can still matter—especially during drought or peak heat, when electricity and water demand rise together.
Liquid Cooling Is Not the Same as Water Consumption
As rack density increases, moving heat through liquid becomes attractive because liquids carry heat far more effectively than air. Direct-to-chip and immersion systems can improve server thermal performance and reduce fan energy.
But “liquid cooled” does not tell you how much freshwater a site consumes.
A closed internal loop can circulate the same fluid repeatedly. The decisive question is what happens at the facility boundary. A cooling tower may reject heat efficiently by evaporating water. A dry cooler can sharply reduce water use while consuming more electricity and losing efficiency during hot weather. Hybrid systems trade between the two. Reclaimed water can reduce potable demand without eliminating total consumption.
The optimization target is therefore not water alone. It is water, power, cost, reliability, and local scarcity at the same time.
The Geography of Concentration
The strongest evidence comes from basins, not global totals.
Ceres modeled cumulative data-center growth around Phoenix and projected electricity-associated annual water use rising from 2.9 billion gallons to more than 14.5 billion, while direct cooling use could rise from 385 million to more than 3.7 billion gallons. Depending on the scenario, basin stress increased by up to 17% annually [3]. These are regional projections with explicit assumptions—not a national forecast.
Northern Virginia presents a different constraint: one of the world’s largest data-center clusters sits inside a mature urban water and power system. EESI cites roughly 2 billion gallons of 2023 water use across the region’s facilities, while emphasizing options such as closed-loop cooling, reclaimed water, and lower-water electricity [4]. The evidence supports a planning problem; it does not support claiming that data centers alone are visibly draining the Potomac.
Across all markets, weak facility-level disclosure makes cumulative impact difficult to assess. A single efficient campus can look benign while dozens of projects, power plants, and transmission upgrades push the same basin toward a threshold.
The constraint is cumulative.
The Market Has Not Built a Pure Water Trade
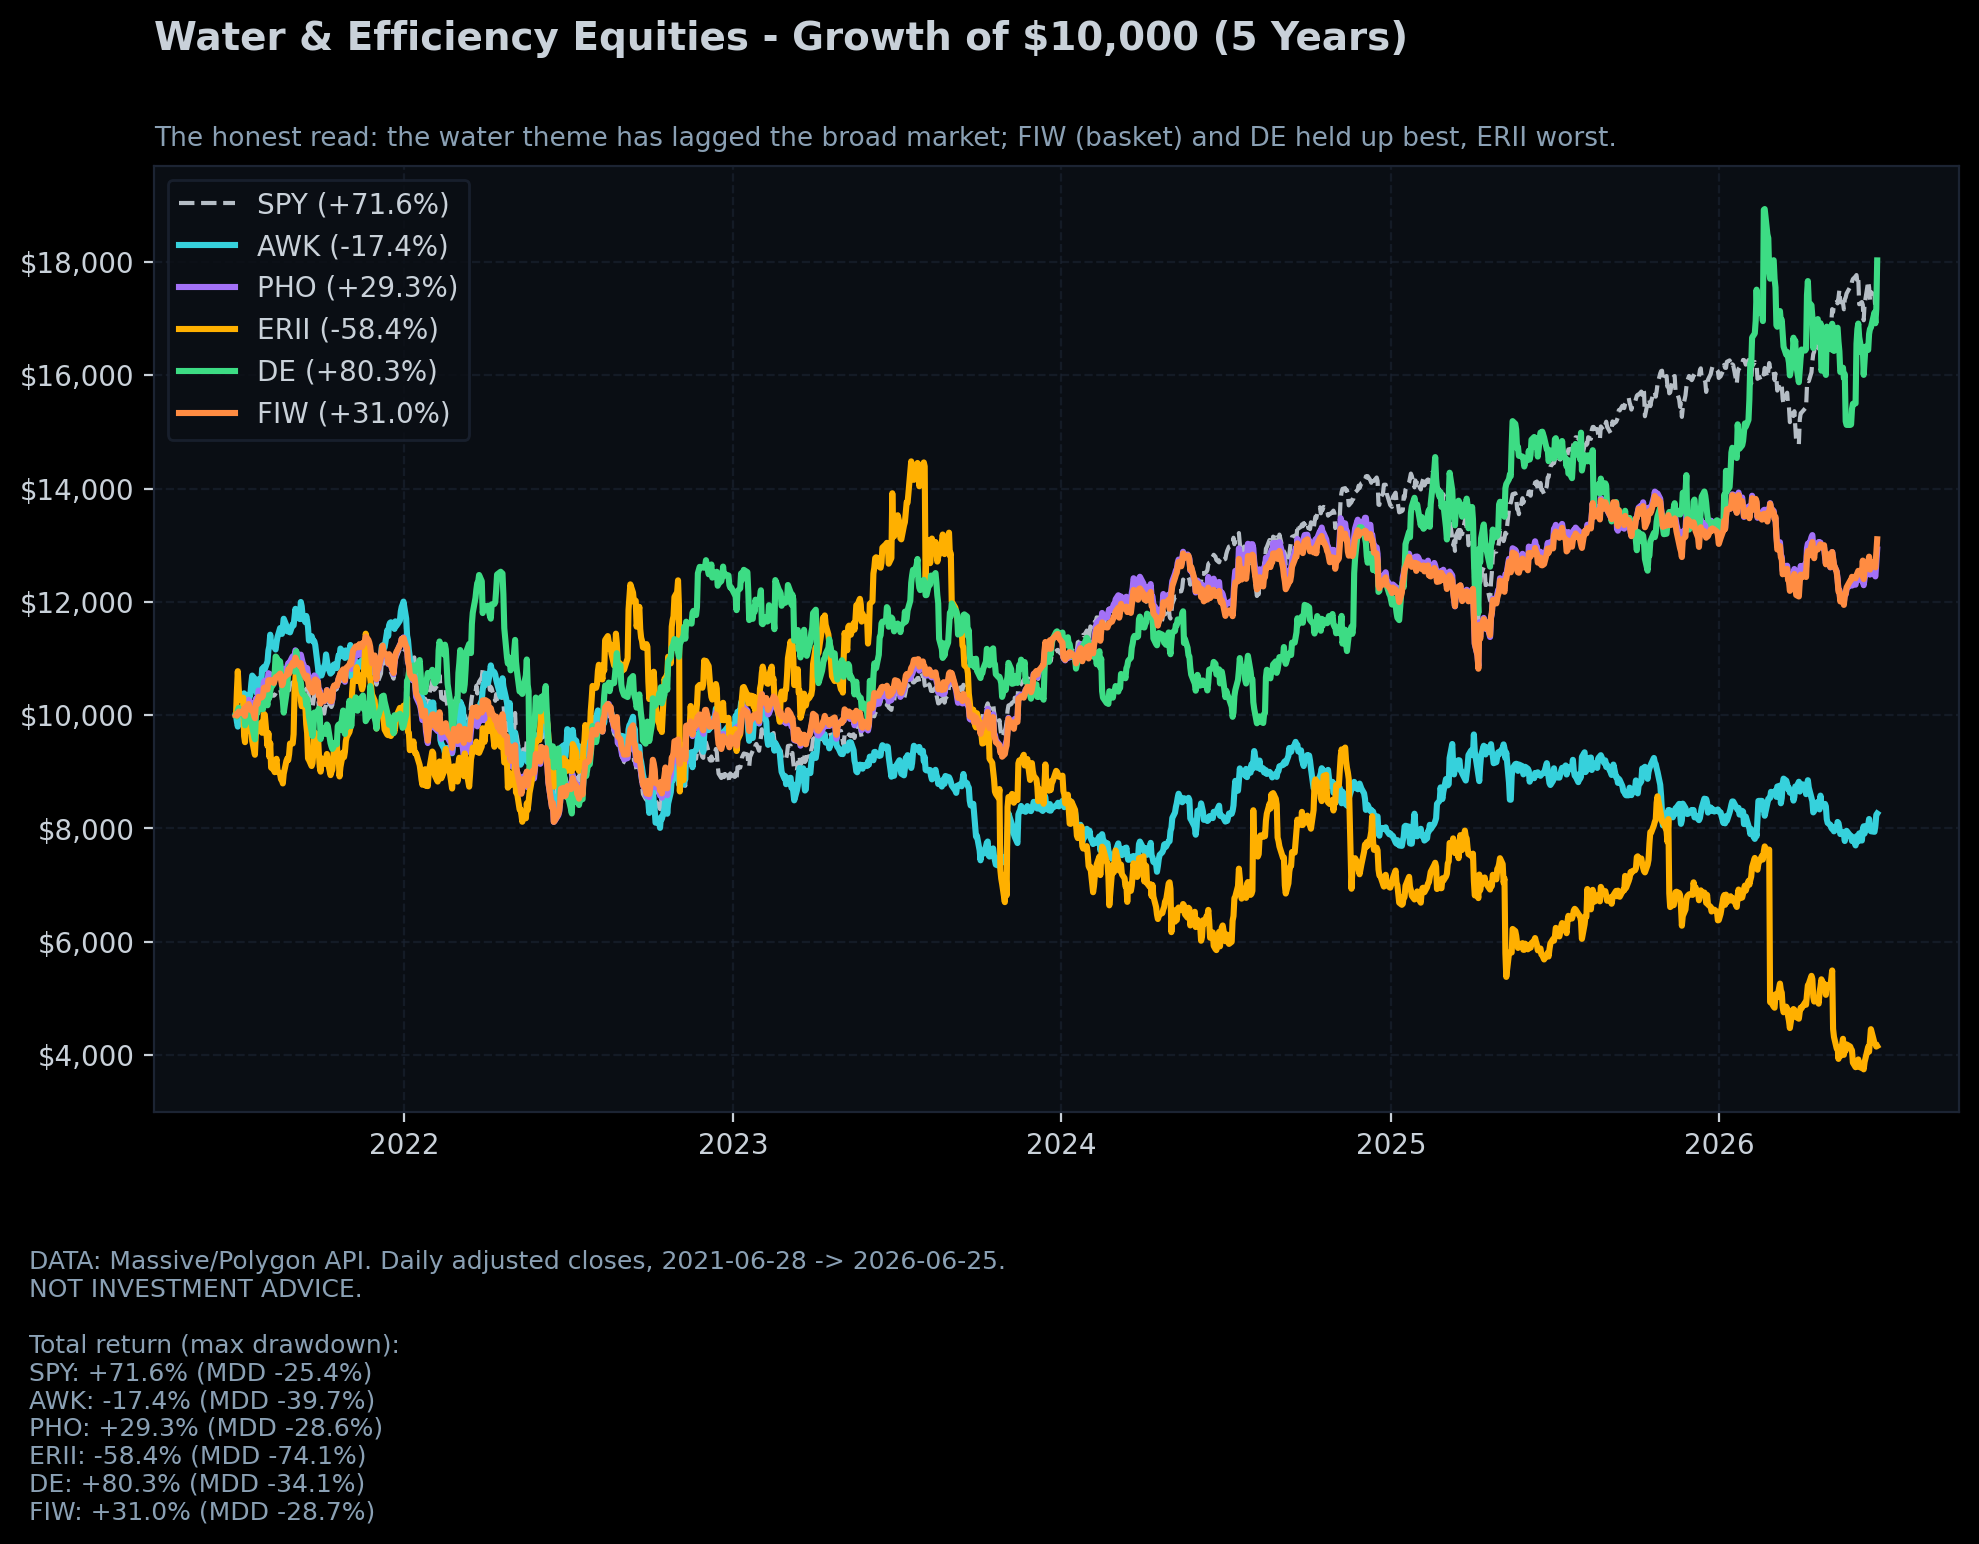
Adjusted-price history through the chart’s stated cutoff. These companies and funds differ sharply in what they own; the visual is an exposure comparison, not a portfolio recommendation.
Cooling and power infrastructure — Vertiv (VRT) and nVent (NVT). Vertiv sells power and thermal-management systems, including air and liquid cooling. nVent’s Systems Protection business includes enclosures, power distribution, and liquid- and air-cooling products. Both can benefit from denser computing, but both face execution, capacity, supply-chain, tariff, acquisition, and technology-shift risk [5] [6]. Neither is a pure water-efficiency company.
Regulated water infrastructure — American Water Works (AWK). AWK owns regulated systems and must invest heavily in treatment, pipes, supply, and resilience. Drought and restricted sources can justify capital spending, but regulators determine when and how that spending enters rates. Financing cost, affordability, contamination, allocation limits, and regulatory lag are central risks [7]. This is a utility, not a tradable water right.
Water technology — Xylem (XYL). Xylem spans pumps, treatment, reuse, metering, leak detection, and analytics. That breadth is useful and dilutive: municipal budgets, project execution, competition, input availability, trade policy, and connected-product cybersecurity all matter [8].
Desalination efficiency — Energy Recovery (ERII). ERII’s pressure-exchanger technology is concentrated in seawater reverse osmosis, with emerging wastewater applications. The physical value proposition is clear: recover pressure energy and reduce desalination power consumption. The security remains a small, concentrated project business exposed to customer timing, geography, competition, and adoption beyond its core market [9]. Stale insider-trading anecdotes are not a substitute for current operating evidence.
Diversified fund exposure — First Trust Water ETF (FIW). FIW held 36 companies in September 2026 and was nearly 60% industrials. Its largest positions included laboratory-instrument and industrial companies as well as utilities [10]. It is broad water-sector exposure, not a pure AI-cooling or scarcity fund.
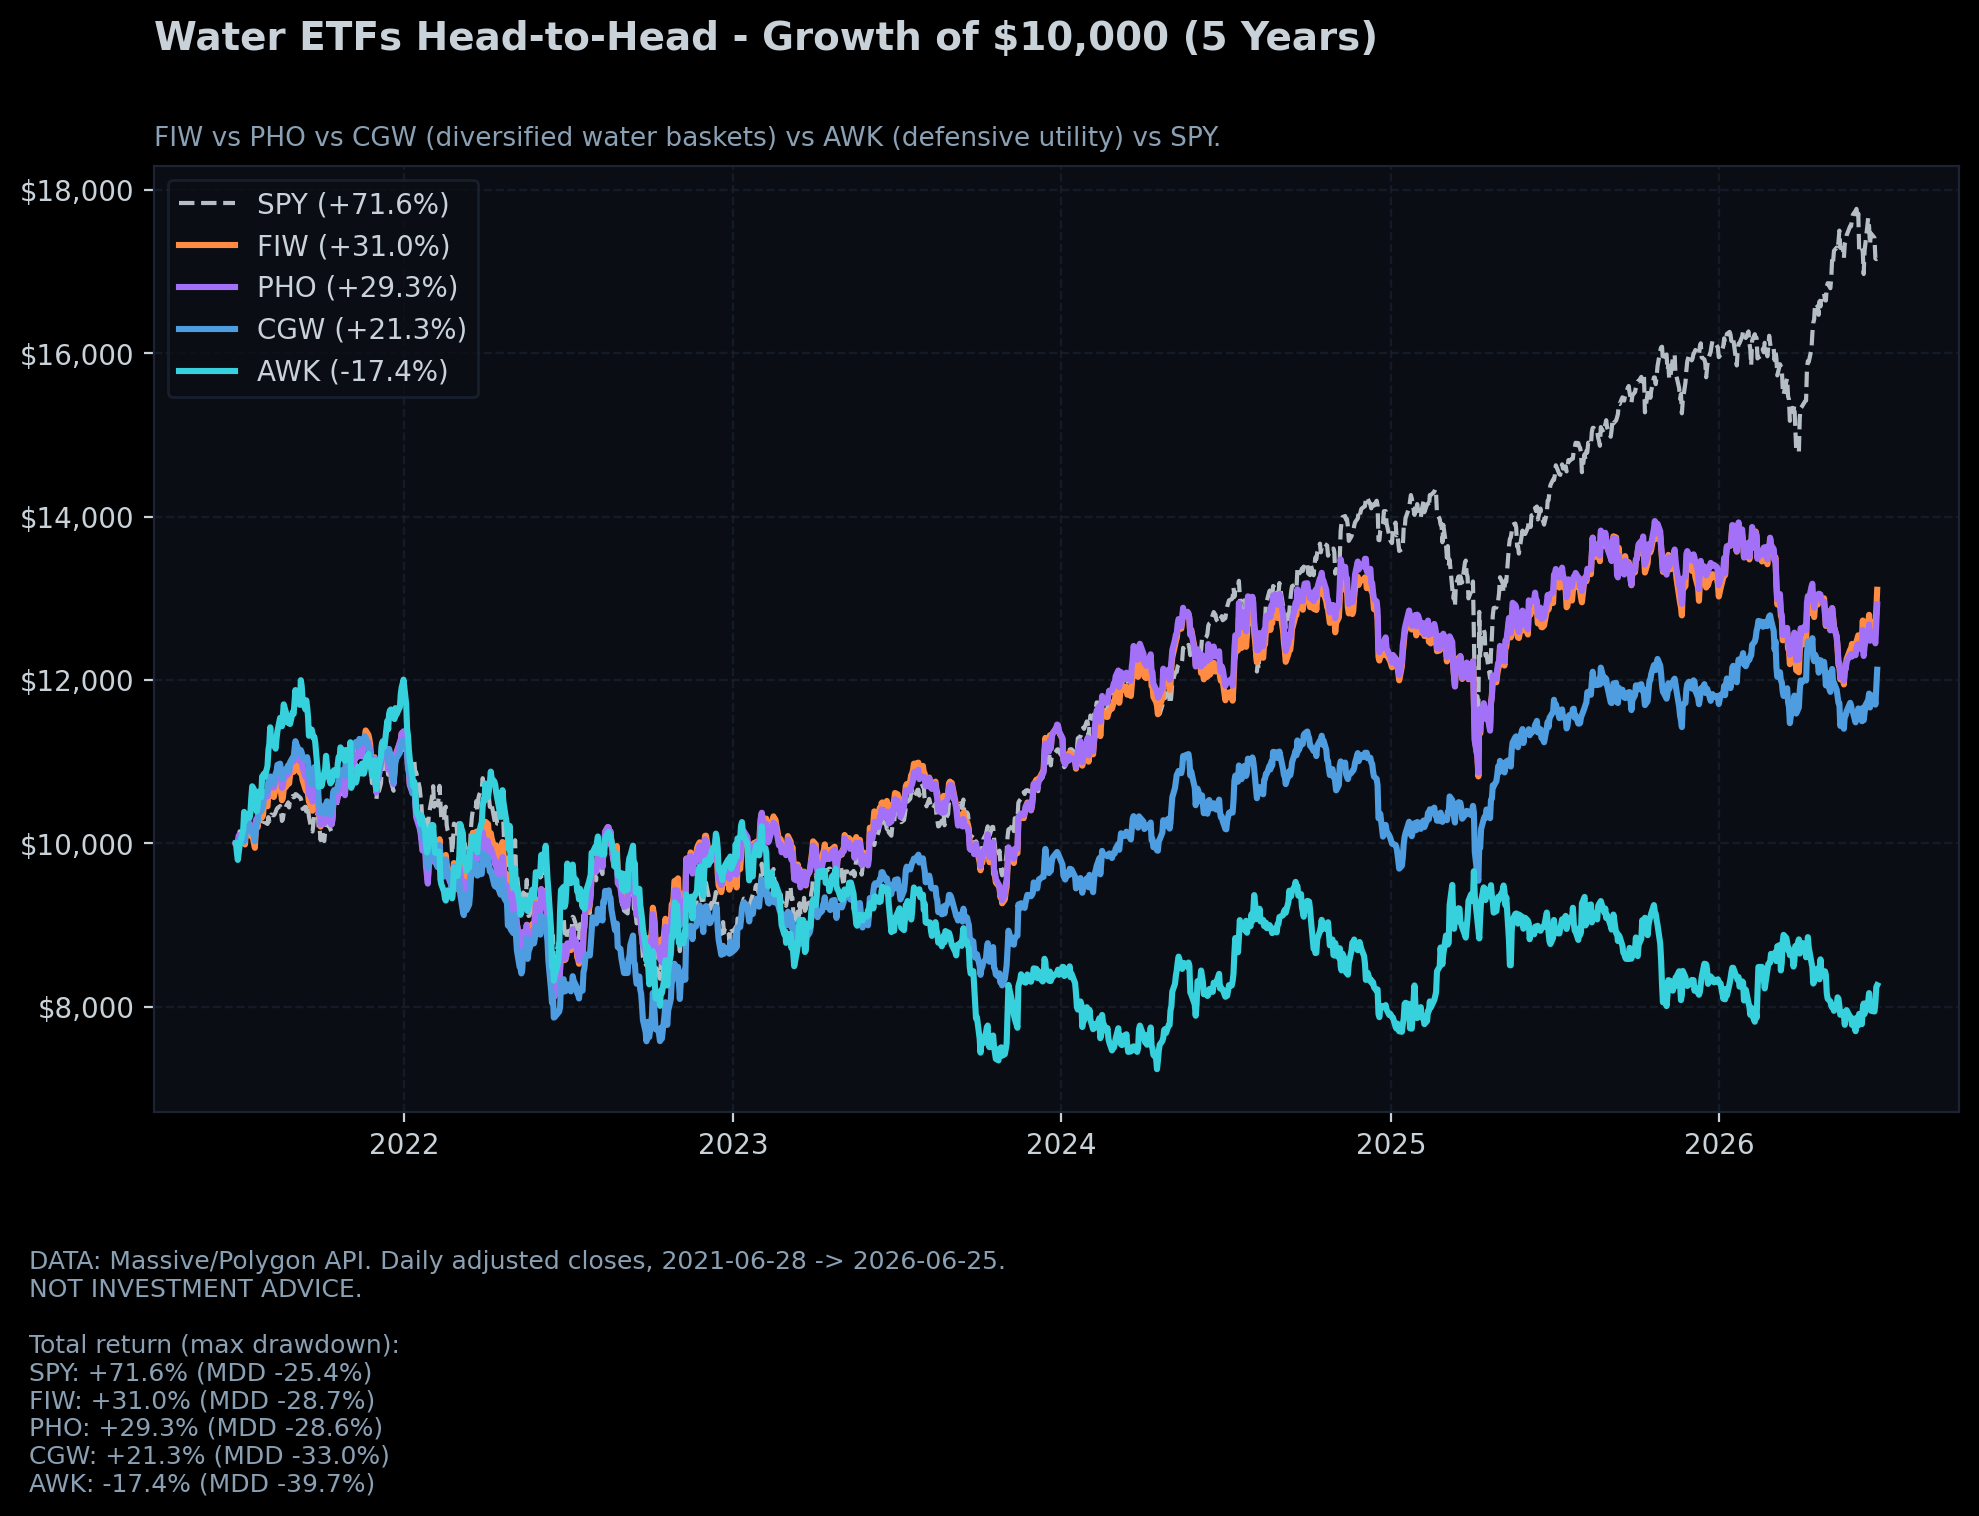
Fund labels do not guarantee direct exposure to the bottleneck. Holdings, fees, sector mix, and valuation matter.
What Could Break the Thesis?
The hyperscalers can move workloads to cooler or wetter regions. Closed-loop systems, dry cooling, reclaimed water, lower-water power, and better chips can reduce freshwater intensity. Regulators can require disclosure and basin-level planning before conflict escalates. Efficiency may improve faster than compute demand grows.
The equity risk is separate. Cooling companies can overbuild. Utilities can face rate resistance. Water funds can lag because they own expensive, slow-growing industrials. A useful technology can remain a poor stock if revenue timing, competition, or valuation disappoints.
The thesis survives only in its precise form: AI adds a new, concentrated industrial load to specific grids and watersheds. Where those systems lack slack, cooling design and water infrastructure become strategic.
The market has priced the chips. It has begun to price the power. The next argument is over where the heat—and the water used to move it—will go.
Continue the Water Nexus: Part 2 — The Dry Mine, where water scarcity moves upstream into copper and lithium supply.
References
[1] “Data Centers Water Footprint: The Need for More Transparency,” AGU Advances (2026)
[2] Congressional Research Service, Data Centers and Water: Frequently Asked Questions (2026)
[3] Ceres, Drained by Data: The Cumulative Impact of Data Centers on Regional Water Stress (2025)
[4] Environmental and Energy Study Institute, “Data Centers and Water Consumption” (2025)
[5] Vertiv Holdings, SEC filings
[6] nVent Electric, SEC filings
[7] American Water Works, SEC filings
[9] Energy Recovery, SEC filings
[10] First Trust, “Water ETF (FIW)” — holdings and disclosures
This article is for informational and educational purposes only. It is not investment advice, a recommendation, or an offer to buy or sell any security. The author may hold positions in securities discussed. See the site’s full Disclaimer & Securities Disclosure.
Found this useful? AtomProphet is independent and reader-funded — you can support the research & hosting ↓
Get the next cascade in your inbox
One short email when a new analysis drops — a single constraint traced end to end, from the physics to the chokepoint to the tickers, with the honest bear case kept in view. No marketing, no tracking, no noise.
- One email per published analysis — typically a few a month, never a daily blast
- The full cascade: driver → chokepoint → vetted, live-liquidity tickers
- The counter-case spelled out, not buried
No account, no paywall. Double opt-in, and one-click unsubscribe in every email.
Support the research & hosting
AtomProphet is independent, ad-light, and reader-funded. Contributions help cover data feeds, hosting, and the time behind the Cascade Graph — they keep this research free and open. A tip buys nothing, unlocks nothing, and is not payment for advice or for any security mentioned anywhere on this site.
Bitcoin37h98hpiHz6BW6ELvRLagk7BBo8UUtxeSh USDC · Base 0x1ac1Abe9eCAd5fAd8fF55B188E079b52cD1e6415