
The Uninsurable Future: When Risk Leaves the Balance Sheet
The physical economy breaks first where the risk models stop clearing the market.
When expected loss rises faster than premiums can adjust, insurers do not simply charge more. They reduce limits, raise deductibles, decline renewals, or leave. Homeowners move into last-resort pools. Primary carriers buy more reinsurance. Reinsurers transfer peak exposure to capital markets.
The risk does not disappear. It changes owners.
That migration is the insurance cascade: physical hazard → insured loss → primary-market retreat → reinsurance demand → catastrophe bonds and public backstops.
Three Different Gaps
The language around climate risk often mixes quantities that are not interchangeable.
Swiss Re estimates $220 billion of global natural-catastrophe economic losses in 2025 and $107 billion of insured losses across 190 events [1]. The simple uninsured share of that year’s observed loss was therefore about $113 billion.
Swiss Re separately estimates a $424 billion natural-catastrophe protection gap for 2025 in premium-equivalent terms [2]. That is a model of expected loss and the premium required to insure it—not the arithmetic difference between one year’s economic and insured loss.
Long-horizon estimates of trillions of dollars in physical climate impact describe something broader still. They should not be relabeled as an insurance protection gap.
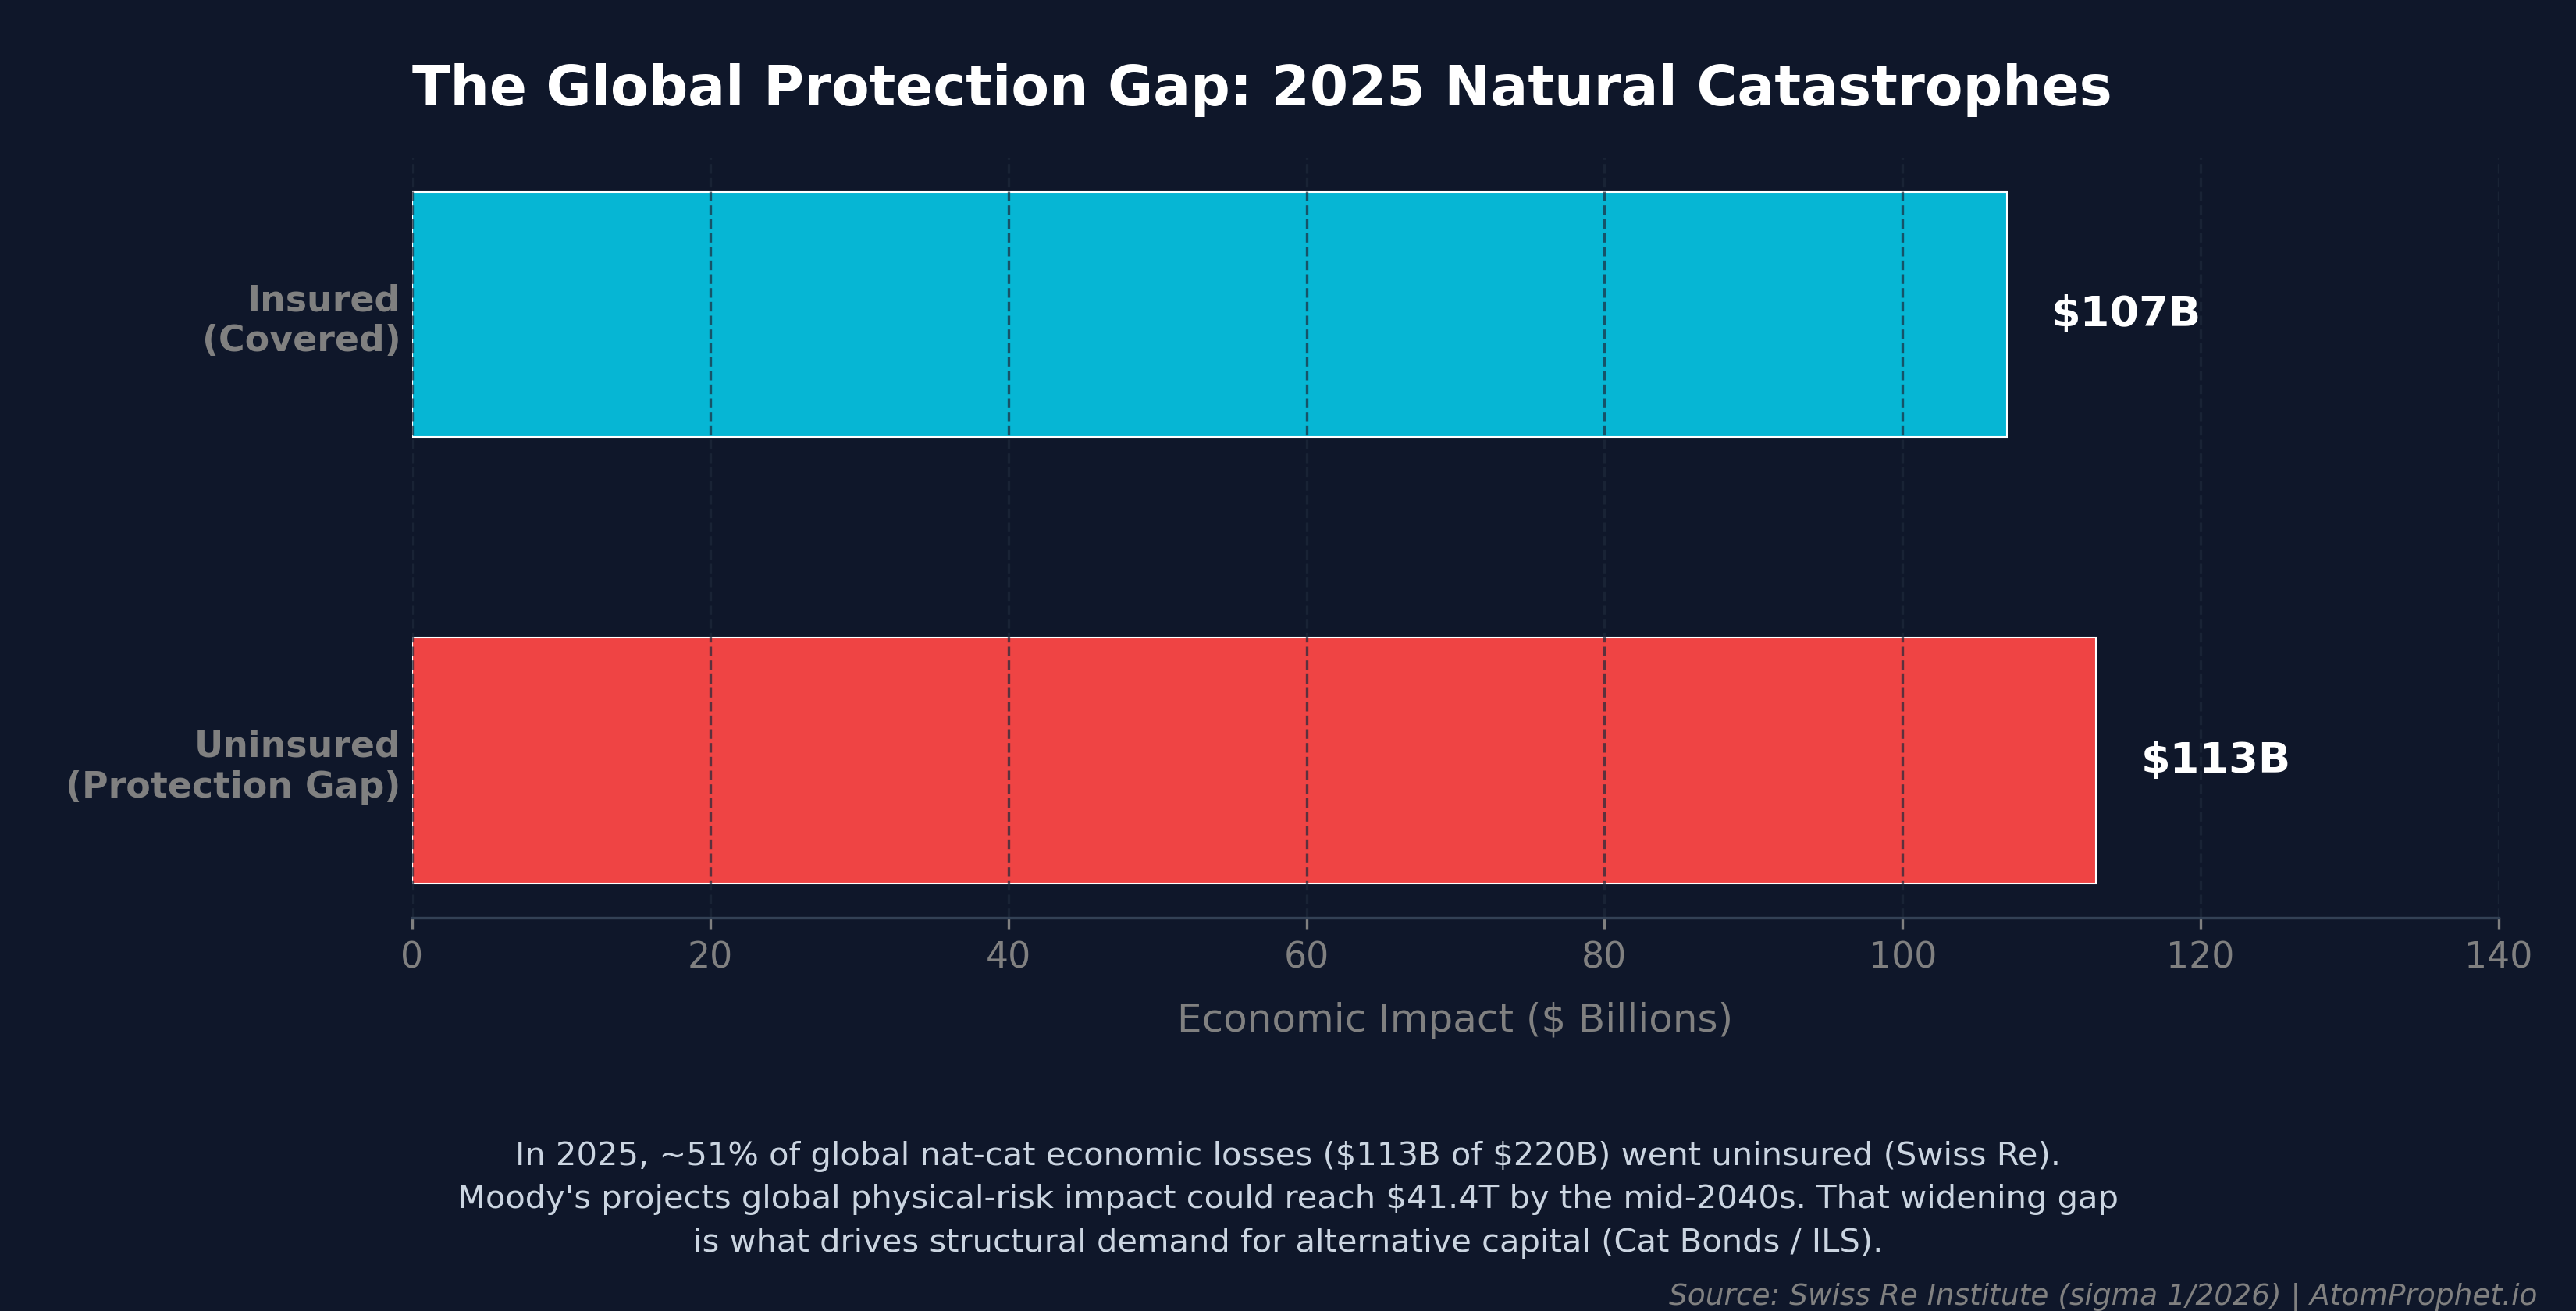
Observed annual losses and modeled protection need answer different questions. The chart keeps them separate.
The distinction sharpens the thesis. The investable mechanism is not “climate damage is large.” It is that more risk must be priced, pooled, retained, transferred, or socialized.
The State Becomes Part of the Capital Stack
California’s FAIR Plan illustrates the migration. By June 2026, it reported 696,562 policies, $768 billion of exposure, and $2.04 billion of written premium [3]. Climate-driven wildfire risk is part of that growth, alongside rate adequacy, regulation, construction costs, market structure, and insurer strategy.
A last-resort pool is not free capacity. If losses outrun its resources, assessments can move back to participating insurers and, ultimately, policyholders or taxpayers. Private retreat can therefore concentrate risk rather than remove it.
This is the uncomfortable endpoint of the cascade: when a market cannot price coverage that households can afford, the problem becomes political.
Catastrophe Bonds: Risk With a Trigger
Catastrophe bonds let insurers and reinsurers transfer defined layers of disaster risk to investors. The collateral is generally invested in short-duration assets. Investors receive a floating-rate return plus a risk spread. If a covered event meets the bond’s trigger, some or all principal can be diverted to the sponsor.
That return is not “yield” in the ordinary credit sense. It is compensation for a low-frequency loss that may arrive abruptly and cluster with other events.
Triggers differ. Indemnity structures reference the sponsor’s actual losses and reduce basis risk for the insurer, but settle more slowly and expose investors to the sponsor’s claims process. Industry-loss, parametric, and modeled-loss structures can settle more quickly, but the payout can diverge from the sponsor’s realized damage.
Model uncertainty is the product. Wildfire, flood, and severe convective storm can behave differently from the perils and geographies on which historical models were trained.
The Market Is Scaling
Artemis reports record catastrophe-bond issuance of $25.6 billion in 2025 and a $61.3 billion outstanding market at year-end. First-half 2026 issuance approached $18 billion, while the outstanding market reached $65.6 billion [4].
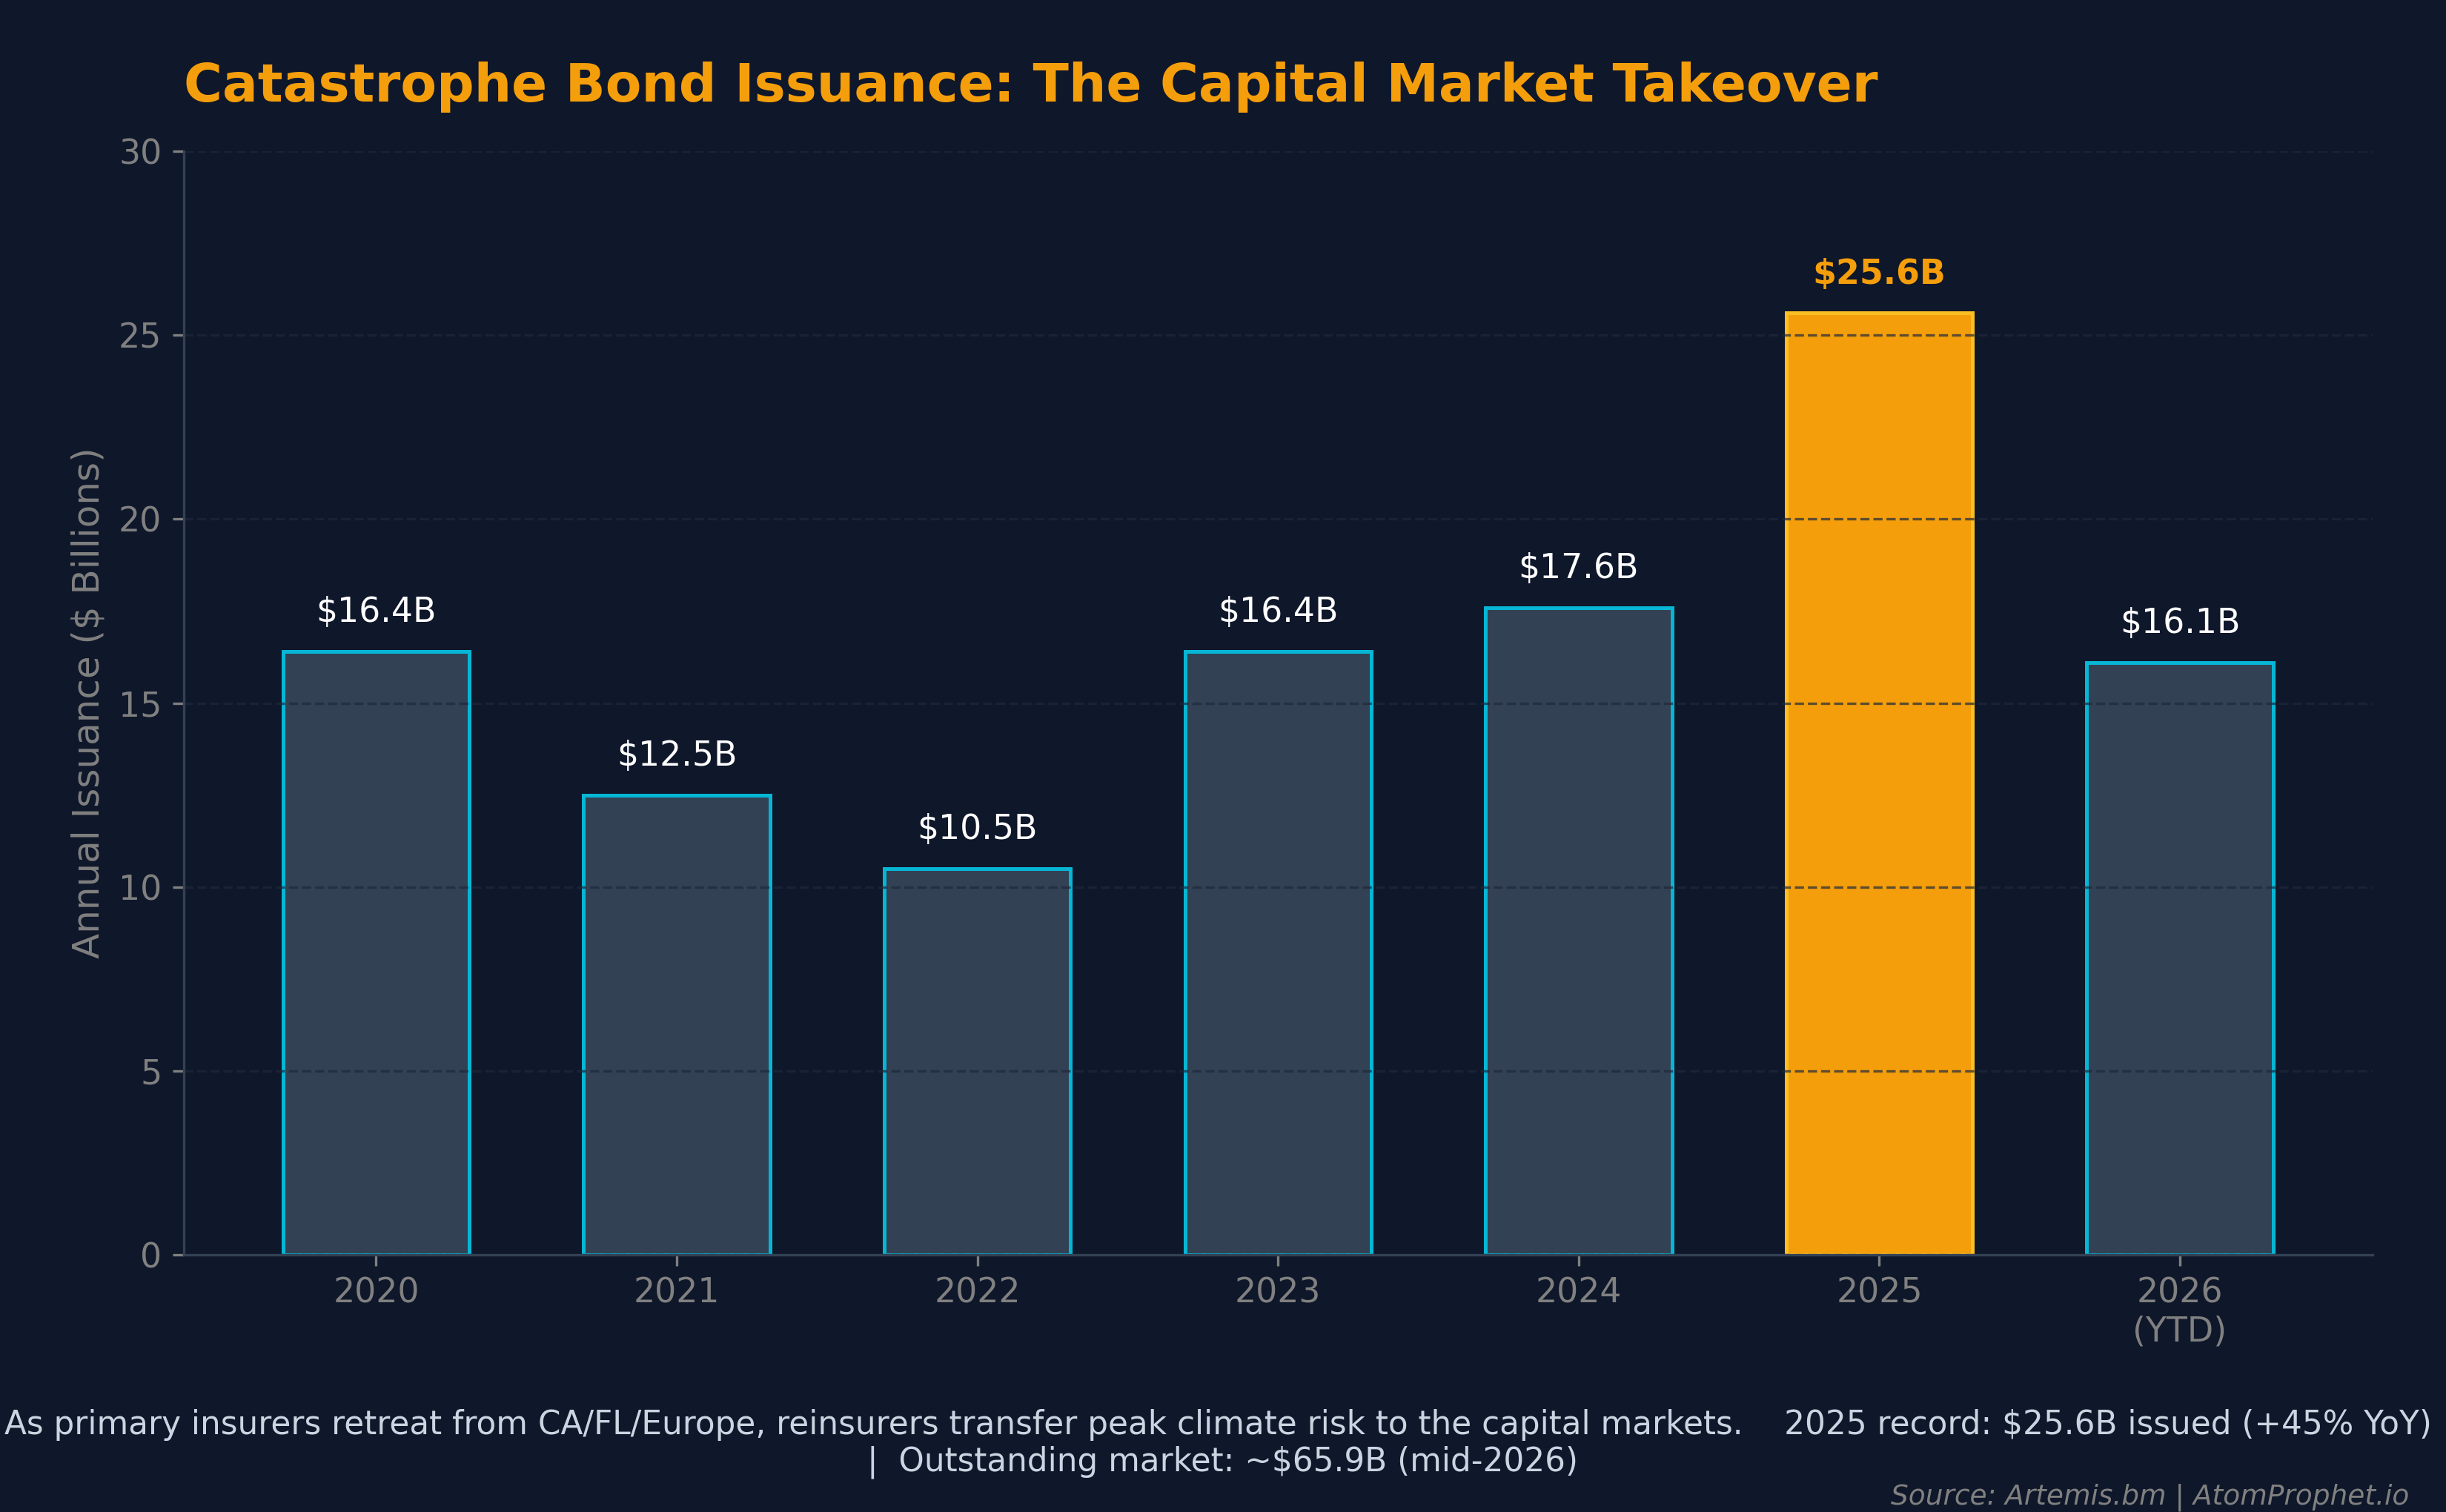
The 2026 observation is a first-half total, not a full calendar year. Issuance measures capital entering the market; it does not guarantee investor returns.
Alternative capital can increase capacity and reduce the price of reinsurance. That is both the bull case and the counterforce. More demand for protection expands the market; more investor capital can compress spreads.
The Exposure Ladder
The terminals differ in how directly they hold catastrophe risk.
| Exposure | How it participates | What can break |
|---|---|---|
| ILS ETF | Holds catastrophe bonds and related collateral | Triggered principal loss, model error, event clustering, liquidity mismatch, high fees |
| RenaissanceRe (RNR) | Property-catastrophe underwriting plus third-party capital and fee income | Major-event loss, reserve error, retrocession cost, soft pricing, investment volatility |
| Everest Group (EG) | Insurance and reinsurance balance-sheet exposure | Catastrophe loss above modeled expectations, reserve development, pricing cycle, ratings pressure |
| Aon (AON) / Marsh (MMC) | Brokerage, structuring, advisory, and placement fees | Slower placements, regulation, compensation changes, cyber risk, disintermediation |
Brookmont Catastrophic Bond ETF (ILS) is the most direct exchange-traded route. It is also young and expensive. As of September 2026, it had about $108 million in assets, a 2.65% expense ratio, and a meaningful Treasury-bill/cash sleeve [5]. Daily liquidity in the wrapper does not make every underlying 144A bond continuously liquid.
RenaissanceRe combines direct catastrophe underwriting with third-party-capital management. Its model can benefit from both pricing and fee income, but its filings emphasize catastrophe volatility, reserve uncertainty, model error, retrocession costs, and investment risk [6].
Everest is a more direct balance-sheet expression. It can earn attractive underwriting returns in disciplined markets and absorb severe losses when events exceed assumptions. Its own filing warns that analytical models can vary materially from outcomes [7].
Aon and Marsh are lower-beta adjacency. They earn fees for broking and structuring risk rather than primarily retaining it. Their businesses are diversified, and climate stress can reduce coverage availability as well as increase demand for advice. They are not pure catastrophe securities [8] [9].
This is an exposure map, not a ranking or recommendation.
What Could Break the Thesis?
Adaptation can reduce losses. Swiss Re’s review of U.S. resilience projects found a median projected benefit-cost ratio of 1.86 [2]. Better building codes, defensible space, flood control, sensors, and land-use policy can improve insurability.
Capital can also flood the market faster than risk grows, softening reinsurance prices and cat-bond spreads. A quiet period can make investors underprice tail risk; a clustered event year can drive them away. Governments may expand public backstops or rewrite coverage rules, crowding out private capital while moving losses to taxpayers.
The insurance market will not fail everywhere at once. It will become more conditional: higher deductibles, narrower terms, more exclusions, more public support, and more risk transferred to investors.
The future is not uninsurable in the literal sense. It is insurable at a price—and the fight over who pays that price is becoming one of the largest capital-allocation problems in the physical economy.
References
[1] Swiss Re Institute, Natural catastrophes in 2025 (sigma 1/2026)
[2] Swiss Re Institute, “Natural catastrophe protection gap” (2026)
[3] California FAIR Plan, “Key Statistics and Data” (through June 2026)
[4] Artemis, Catastrophe Bond & ILS Market Reports
[5] Brookmont, “Catastrophic Bond ETF (ILS)” — holdings and disclosures
[6] RenaissanceRe, SEC filings
[7] Everest Group, SEC filings
[8] Aon, SEC filings
[9] Marsh McLennan, SEC filings
This article is for informational and educational purposes only. It is not investment advice, a recommendation, or an offer to buy or sell any security. The author may hold positions in securities discussed. See the site’s full Disclaimer & Securities Disclosure.
Liquidity & size of the names above
Data as of 2026-06-26 · Massive/Polygon, last ~30 trading days · figures move daily
Real figures from market data (2026-06-23 (last ~30 trading days)). Size tiers reflect median daily dollar volume — how easily a position can actually be entered or exited. This is reference data, not a recommendation.
Liquidity, in plain terms: how easily you can get in and out. Deep means you can trade freely without moving the price; Thin means even small orders can move it — mind the spread.
What this does not tell you — valuation. A real structural deficit does not mean the price hasn’t already discounted it. These figures show size and tradeability only; we deliberately do not screen for valuation, solvency, or whether a name is cheap or expensive today. Do your own valuation work.
| Ticker | Name | Type | Market cap | Median daily $ vol | Liquidity |
|---|---|---|---|---|---|
| RNR | RenaissanceRe Holdings Ltd.Bermuda reinsurer with a large third-party ILS capital platform; earns hard-market underwriting margins PLUS capital-light fee income for managing other people's catastrophe capital. The truest single-name expression of the risk-transfer thesis; still two-sided (a major cat year hits book value). | Stock | $13.2B | $98.1M | Liquid |
| AON | Aon plc Class ADominant global broker (incl. reinsurance via Aon Re). Fee/commission model — does NOT hold catastrophe risk; profits from the volume and repricing of risk transfer. Lower-beta adjacency that does best when the market is functioning, not collapsing. | Stock | $69.5B | $509.8M | Deep |
| MMC | Marsh McLennan — insurance/reinsurance brokerWorld's largest insurance broker; reinsurance via Guy Carpenter. Same fee-based, lower-beta intermediary profile as AON; benefits from rising premium volume and ILS issuance flow rather than holding tail risk. | ETF | n/a · ETF | n/a | Unknownthin — mind the spread |
| EG | Everest Group, Ltd.Active reinsurer that benefits from hard-market pricing but carries catastrophe risk more nakedly than RNR (less fee-based ILS buffer). The most two-sided profile here: strong quiet years, painful loss years. | Stock | $13.7B | $131.2M | Deep |
| ILS | Brookmont Catastrophic Bond ETFFirst US-listed, daily-tradable cat-bond ETF (launched Apr 2025). The most direct retail way to BE the capital earning the premium insurers pay to shed tail-risk; low-volatility/bond-like, NOT equity-style upside. Young/small fund — liquidity caveat; NAV would drop sharply if a major insured catastrophe triggers the underlying bonds. | ETF | n/a · ETF | $598.6K | VeryThinthin — mind the spread |
Tiers: Deep ≥ $100M/day · Liquid $20–100M · Moderate $3–20M · Thin $1–3M · < $1M = execution risk. The note under each name is a sourced exposure disclosure (how pure or diluted the play is), not a valuation view. Source: Massive/Polygon aggregates, last ~30 trading days (snapshot 2026-06-26). Figures move daily.
Found this useful? AtomProphet is independent and reader-funded — you can support the research & hosting ↓
Get the next cascade in your inbox
One short email when a new analysis drops — a single constraint traced end to end, from the physics to the chokepoint to the tickers, with the honest bear case kept in view. No marketing, no tracking, no noise.
- One email per published analysis — typically a few a month, never a daily blast
- The full cascade: driver → chokepoint → vetted, live-liquidity tickers
- The counter-case spelled out, not buried
No account, no paywall. Double opt-in, and one-click unsubscribe in every email.
Support the research & hosting
AtomProphet is independent, ad-light, and reader-funded. Contributions help cover data feeds, hosting, and the time behind the Cascade Graph — they keep this research free and open. A tip buys nothing, unlocks nothing, and is not payment for advice or for any security mentioned anywhere on this site.
Bitcoin37h98hpiHz6BW6ELvRLagk7BBo8UUtxeSh USDC · Base 0x1ac1Abe9eCAd5fAd8fF55B188E079b52cD1e6415