
The Cascade Thesis: Economics Is Downstream of Physics
Markets price companies. Physics prices systems.
For four decades, the global economy was optimized around cheap energy, abundant credit, just-in-time logistics, and the assumption that strategic goods would keep crossing borders. That architecture delivered extraordinary efficiency. It also removed slack from the systems that feed, power, cool, insure, and defend modern civilization.
Now those systems are colliding. Artificial intelligence raises electricity and cooling demand [4]. Grid expansion raises demand for copper. Lower ore grades make copper more water- and energy-intensive. Water scarcity and aquifer decline force desalination and deeper pumping, which require still more electricity and metal [5]. Climate losses push risk from homeowners to insurers, from insurers to reinsurers, and from reinsurers into capital markets [3].
This is The Cascade Thesis: a method for following physical constraints as they migrate through the economy.
It is not a forecast of collapse. It is not a model portfolio. It is a map of transmission mechanisms.
The Unit of Analysis Is the Chain
Most market narratives stop at the first-order effect. More data centers mean more semiconductors. More electric vehicles mean more batteries. More storms mean higher insurance premiums.
The investable consequence often appears several links later:
A new demand shock hits a physical bottleneck. The bottleneck changes costs, policy, and behavior. Those responses create the next bottleneck.
Consider one chain already visible in the research:
- The IEA estimates data centers used about 415 TWh of electricity in 2024 and, in its Base Case, reach roughly 945 TWh by 2030 [1].
- Power demand concentrates around specific grids, where generation, transmission, and interconnection capacity cannot be added at software speed.
- Grid reinforcement and firm generation increase demand for copper, uranium, cooling equipment, and water infrastructure.
- Copper grades have declined, new mines take roughly 17 years from discovery to production, and many deposits sit in water-stressed jurisdictions [2].
- The response—recycling, substitution, desalination, storage, new generation, and new mines—creates its own demand for capital, energy, and materials.
A conventional sector screen sees separate industries. The Cascade lens sees one connected balance sheet.
Four Recurring Forces
The framework is organized around four forces that repeatedly interact.
| Force | Physical mechanism | Economic transmission |
|---|---|---|
| Scarcity | Water, ore quality, land, grid capacity, fuel, and insurance capital are finite locally | Higher marginal costs, rationing, substitution, and infrastructure spending |
| Concentration | Critical processing, transport, and production cluster in a few geographies | Political leverage, supply-chain fragility, and friend-shoring |
| Density | AI, industry, and cities concentrate energy and cooling loads | Local constraints bind before global averages look alarming |
| Risk transfer | Losses exceed what households, utilities, or insurers can absorb | Costs migrate to governments, reinsurers, bondholders, and taxpayers |
These forces do not guarantee that a security rises. They identify where the economic pressure is likely to accumulate.
That distinction matters. A correct physical thesis can still produce a bad investment if the company has too much debt, the fund owns the wrong businesses, the cycle turns, regulation caps returns, or the market has already priced the outcome.
The Dual Mandate
The framework separates two kinds of exposure.
The friction side includes assets that may benefit when systems become less reliable: defense capacity, hard assets, secure supply chains, reinsurance, and scarce-resource producers.
The solution side includes the infrastructure required to reduce the friction: firm power, grid equipment, cooling, water treatment, recycling, precision agriculture, and resilient logistics.
The same company can sit on both sides. A copper producer benefits from scarcity but also supplies the material needed to relieve grid constraints. A reinsurer earns higher prices for accepting catastrophe risk but can lose years of profit in one event. A water-technology company may address scarcity while remaining exposed to municipal budgets, project delays, and interest rates.
A note on the word “portfolio.” This is a thematic research framework, not a prescribed allocation. It does not know your objectives, liabilities, time horizon, tax position, or tolerance for drawdowns. Treat it as a map of where to investigate—not an instruction for what to own.
What the Historical Comparison Can—and Cannot—Show
The chart below compares a simple equal-weight basket of six Cascade-related ETFs with the S&P 500 over a common adjusted-price window.
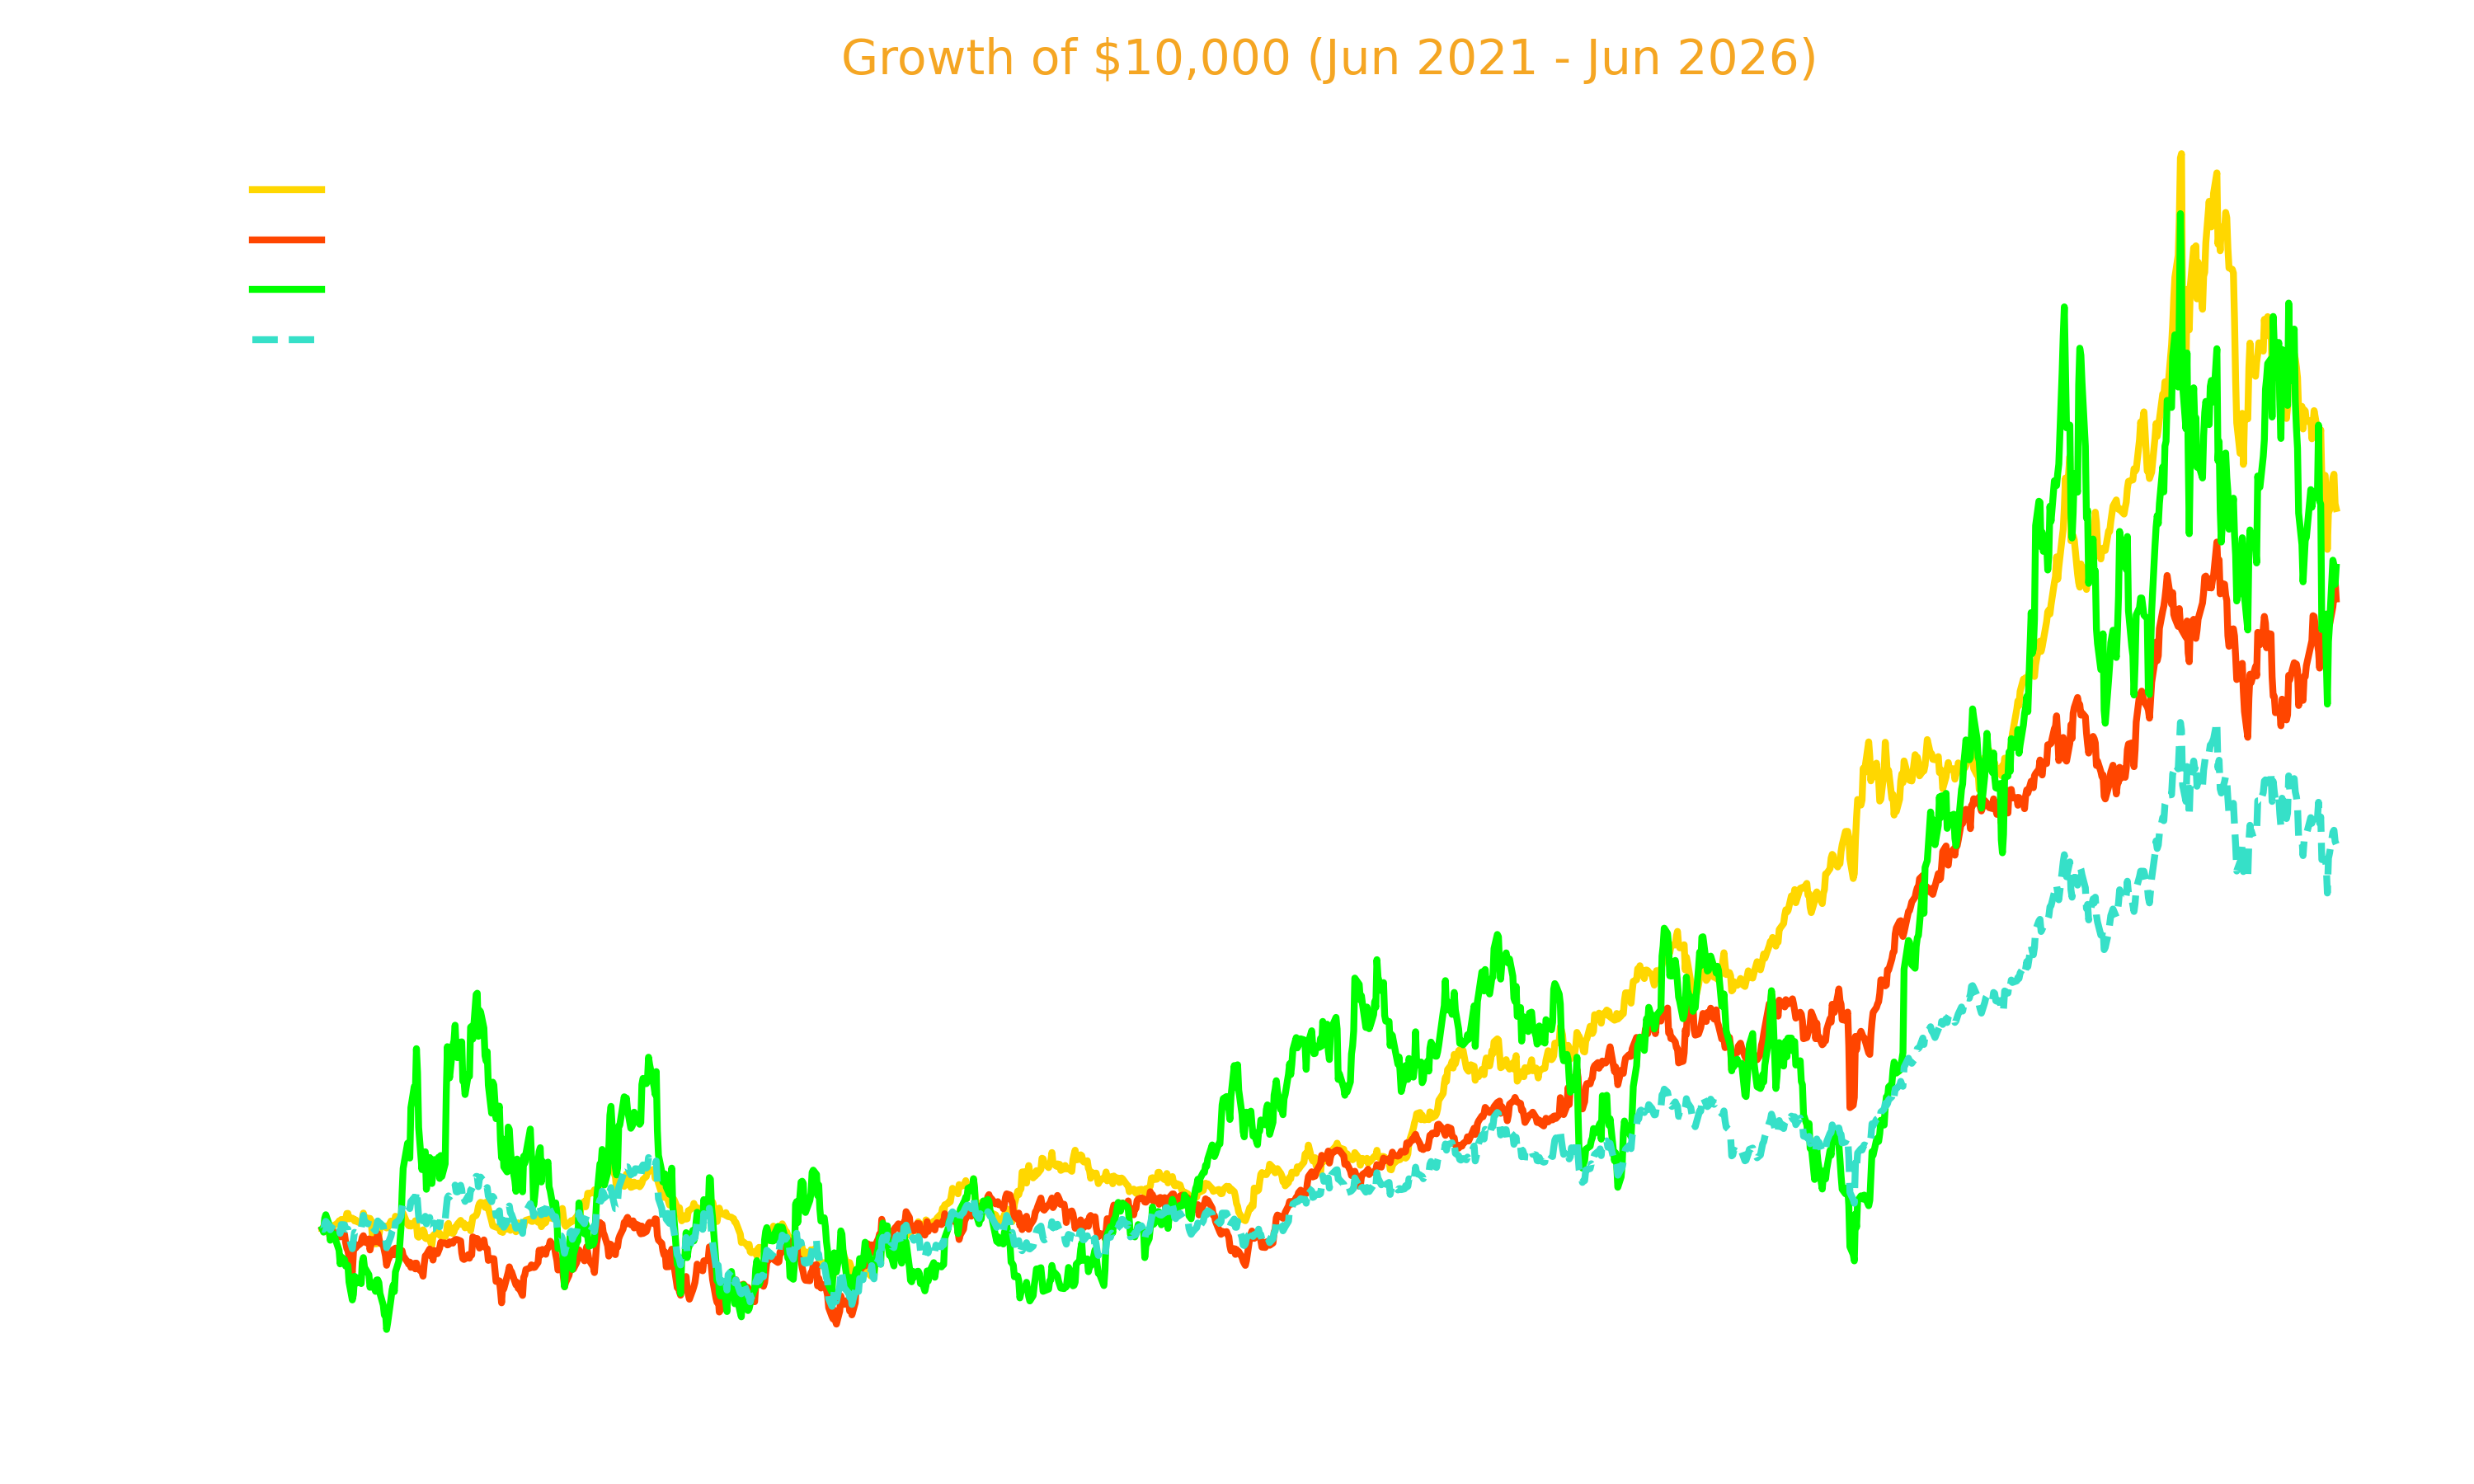
The comparison is deliberately uncomfortable. Some sleeves outperformed. Others lagged badly. The equal-weight basket did not deliver a clean, automatic advantage over the benchmark.
That does not prove or disprove the framework. It demonstrates the central implementation problem: broad ETFs are imperfect proxies, entry price matters, and a physical constraint can intensify for years before the equity market rewards the companies attached to it. Historical returns are descriptive, not causal proof, and they do not establish future alpha.
The lesson is selection, not certainty. Follow the mechanism. Identify who controls the constrained asset, who sells the adaptation, who merely carries the label, and who bears the cost.
The Published Map
The thesis is now testable across a growing set of linked investigations:
- The Nuclear Inevitability follows AI load into firm power and uranium.
- The Northern Pivot separates an opening Arctic from the difficulty of owning it.
- The Copper Chokepoint tracks electrification into geology, refining, and geopolitics.
- The Uninsurable Future follows physical loss into reinsurance and capital markets.
- The Water Nexus moves from AI cooling to mining to agriculture.
Each article is a path through the same graph. Shared nodes are not repetition; they are evidence that the constraints interact.
What Would Break the Framework?
The Cascade Thesis weakens if technology expands supply faster than demand compounds. AI could sharply improve mining, materials science, grid management, crop yields, and energy efficiency. A durable geopolitical détente could reopen low-cost trade routes. A deep global recession could suppress demand for years. Adaptation could prove cheaper and faster than expected.
Those are not footnotes. They are the counterforces that determine timing and valuation.
The thesis is therefore narrower than “scarcity always wins.” It is this:
When demand moves faster than physical systems can respond, the resulting pressure travels through identifiable chains. Investors should study the chain before they study the ticker.
The world is not ending. The map of where costs, power, and opportunity accumulate is changing.
References
[1] International Energy Agency, Energy and AI — Energy demand from AI (2025)
[3] Swiss Re Institute, Natural catastrophes in 2025 (sigma 1/2026)
[4] Congressional Research Service, Data Centers and Water: Frequently Asked Questions (2026)
This article is for informational and educational purposes only. It is not investment advice, a recommendation, or an offer to buy or sell any security. The author may hold positions in securities discussed. See the site’s full Disclaimer & Securities Disclosure.
Liquidity & size of the names above
Data as of 2026-06-26 · Massive/Polygon, last ~30 trading days · figures move daily
Real figures from market data (2026-06-23 (last ~30 trading days)). Size tiers reflect median daily dollar volume — how easily a position can actually be entered or exited. This is reference data, not a recommendation.
Liquidity, in plain terms: how easily you can get in and out. Deep means you can trade freely without moving the price; Thin means even small orders can move it — mind the spread.
What this does not tell you — valuation. A real structural deficit does not mean the price hasn’t already discounted it. These figures show size and tradeability only; we deliberately do not screen for valuation, solvency, or whether a name is cheap or expensive today. Do your own valuation work.
| Ticker | Name | Type | Market cap | Median daily $ vol | Liquidity |
|---|---|---|---|---|---|
| URA | Global X Uranium ETFMost liquid uranium ETF, ER 0.69%, ~$6.6B AUM — but NOT pure uranium: ~25% industrials incl. reactor/SMR & components names, not just miners. | ETF | n/a · ETF | $191.1M | Deep |
| GLD | SPDR Gold Trust, SPDR Gold SharesPhysically-backed gold; a macro/safe-haven sleeve in the framework basket, not a cascade pure-play. | ETF | n/a · ETF | $2.6B | Deep |
| ITA | iShares U.S. Aerospace & Defense ETFClean US aerospace & defense exposure, ER 0.38%; concentrated in primes (RTX, BA, LMT, GD). | ETF | n/a · ETF | $190.1M | Deep |
| PICK | iShares MSCI Global Metals & Mining Producers ETFBroad global metals & mining (diversified miners); a basket proxy for the metals-supply theme, not copper-specific. | ETF | n/a · ETF | $40.5M | Liquid |
| PHO | Invesco Water Resources ETFUS water-infrastructure & treatment names, ER 0.59%; clean thematic water exposure, moderate liquidity. | ETF | n/a · ETF | $6.1M | Moderate |
| MOO | VanEck Agribusiness ETFDiversified agribusiness (equipment, fertilizer, seeds, processors); the low-effort way to own the northern-cropland leg. | ETF | n/a · ETF | $18.0M | Moderate |
Tiers: Deep ≥ $100M/day · Liquid $20–100M · Moderate $3–20M · Thin $1–3M · < $1M = execution risk. The note under each name is a sourced exposure disclosure (how pure or diluted the play is), not a valuation view. Source: Massive/Polygon aggregates, last ~30 trading days (snapshot 2026-06-26). Figures move daily.
Found this useful? AtomProphet is independent and reader-funded — you can support the research & hosting ↓
Get the next cascade in your inbox
One short email when a new analysis drops — a single constraint traced end to end, from the physics to the chokepoint to the tickers, with the honest bear case kept in view. No marketing, no tracking, no noise.
- One email per published analysis — typically a few a month, never a daily blast
- The full cascade: driver → chokepoint → vetted, live-liquidity tickers
- The counter-case spelled out, not buried
No account, no paywall. Double opt-in, and one-click unsubscribe in every email.
Support the research & hosting
AtomProphet is independent, ad-light, and reader-funded. Contributions help cover data feeds, hosting, and the time behind the Cascade Graph — they keep this research free and open. A tip buys nothing, unlocks nothing, and is not payment for advice or for any security mentioned anywhere on this site.
Bitcoin37h98hpiHz6BW6ELvRLagk7BBo8UUtxeSh USDC · Base 0x1ac1Abe9eCAd5fAd8fF55B188E079b52cD1e6415