
The Hydropower Cliff: When Water Becomes a Grid Constraint
Water does not have to disappear for a power system to fail. It only has to fall below the level its turbines, operating rules, and industrial customers were built to expect.
This is Part 4 of the Water Nexus series, after The Thirsty Machine, The Dry Mine and The Sinking Breadbasket. The earlier parts are optional context; this article follows rainfall and reservoir operations into electricity reliability.
The IEA’s 7 October 2026 commentary calls for Latin American electricity systems to prepare for El Niño-linked rainfall risks. That is a timely planning signal, not an announcement of current rationing or a forecast of company profits. 1
Under the Cascade Thesis, this article crosses G2, the Climate–Conflict Spiral, and G4, the Energy Transition Paradox. Using that framework does not attribute any particular event to human-caused climate change.
Drought or failed rainy seasons → lower reservoir inflows → basin-specific water-allocation and operating decisions → possible hydro derating, rationing, or industrial curtailment → may prompt funded investment in grid flexibility, storage, interconnection, diversified generation, and water resilience, where budgets, contracts, and execution align.
The local mechanism is documented. Its recurrence and economic transmission are basin- and institution-specific—not one synchronized global cliff. Colorado, Kariba, Yunnan, and Ecuador are different events with different hydrology, institutions, dates, and recovery paths. The investment question is therefore a testable commercial hypothesis: can a recurring local failure mode lead to funded spending, and does any listed company capture material, profitable work after payer, contract, timing, execution, substitution, and valuation are considered? The evidence below does not complete that test.
How low water becomes less power
Rain and snow become inflow when water reaches a river or reservoir. Storage is the water held for later use. A hydro plant releases some of that water through a turbine; the vertical drop, or head, helps drive the machine. Available power depends on water flow and head. As inflows and water levels change, achievable instantaneous power and seasonal delivered energy can fall before a reservoir is empty, even though nameplate capacity remains unchanged. 2 3 4
Operators must decide how to allocate releases among power, municipal, agricultural, environmental, and other authorized uses. They may conserve water, derate a plant, ration electricity, import power, or curtail industrial demand. Those are operating and institutional choices, not automatic consequences of one gauge reading. Capacity, measured in megawatts (MW), is the power that can be delivered at a moment; energy, measured in megawatt-hours or gigawatt-hours (MWh/GWh), is electricity delivered over time. maf means million acre-feet, a volume measure. Storage is therefore not the same thing as dispatch or generation.
Case key: four dated, non-synchronized systems
- Colorado River / Powell and Hoover — Reclamation, 2026: forecast and modeled risk, an end-August observation, and operating guidance.
- Kariba / Zambezi — ZESCO and the Zambezi River Authority, 2024 and 2026: a historical load-shedding record followed by a later usable-storage comparison.
- Yunnan — aluminium smelters, 2024: hydropower-linked industrial curtailment and a rainfall/restart counterforce.
- Ecuador — CENACE and CELEC, 2024–26: observed historical rationing, a company-specific generation denominator, modeled resilience, and a forward-looking 7 October 2026 planning signal.
These are case studies of local transmission mechanisms, not evidence of simultaneity or a global frequency trend.
Colorado: the threshold is operational, not rhetorical
17 April 2026 — forecast and modeled risk. Reclamation’s minimum-probable scenario forecast Lake Powell water-year 2026 unregulated inflow at 2.78 million acre-feet (maf), 29% of the historical average. Its April 24-Month Study modeled a possible decline below 3,490 feet—the minimum power pool—by August 2026 without intervention. Reclamation also warned that a proposed Powell-release reduction could cause up to an additional 40% reduction in Hoover Dam hydropower generating capacity as early as fall 2026. These were forecast and contingent-risk statements, not realized generation losses. 5
21 May 2026 — elevation-specific engineering estimate. At a Lake Mead elevation of 1,035 feet, Reclamation estimated Hoover’s technically available generating capacity could be 382 MW, versus an earlier 1,302 MW estimate—not measured annual generation or a dispatch total. Reclamation also announced approximately $52 million for infrastructure and maintenance, including up to three wide-head turbine replacements expected to restore at least 160 MW. The restoration was expected work, not evidence that it occurred, and the program is an identifiable spending channel—not evidence that a named listed supplier won it. 2
21 August 2026 — operating guidance. The Department of the Interior announced a 3,510-foot operating-reliability objective for Powell and an initial expected 6.0–7.0 million acre-foot release range for the water year beginning October 2026. A reliability buffer at Powell can redistribute risk; it is not proof that the system has more water. The 3,510-foot objective is a buffer above the 3,490-foot minimum power pool, not a second shutdown threshold. The policy itself is not a measurement of lost generation or evidence that risk has disappeared. 6
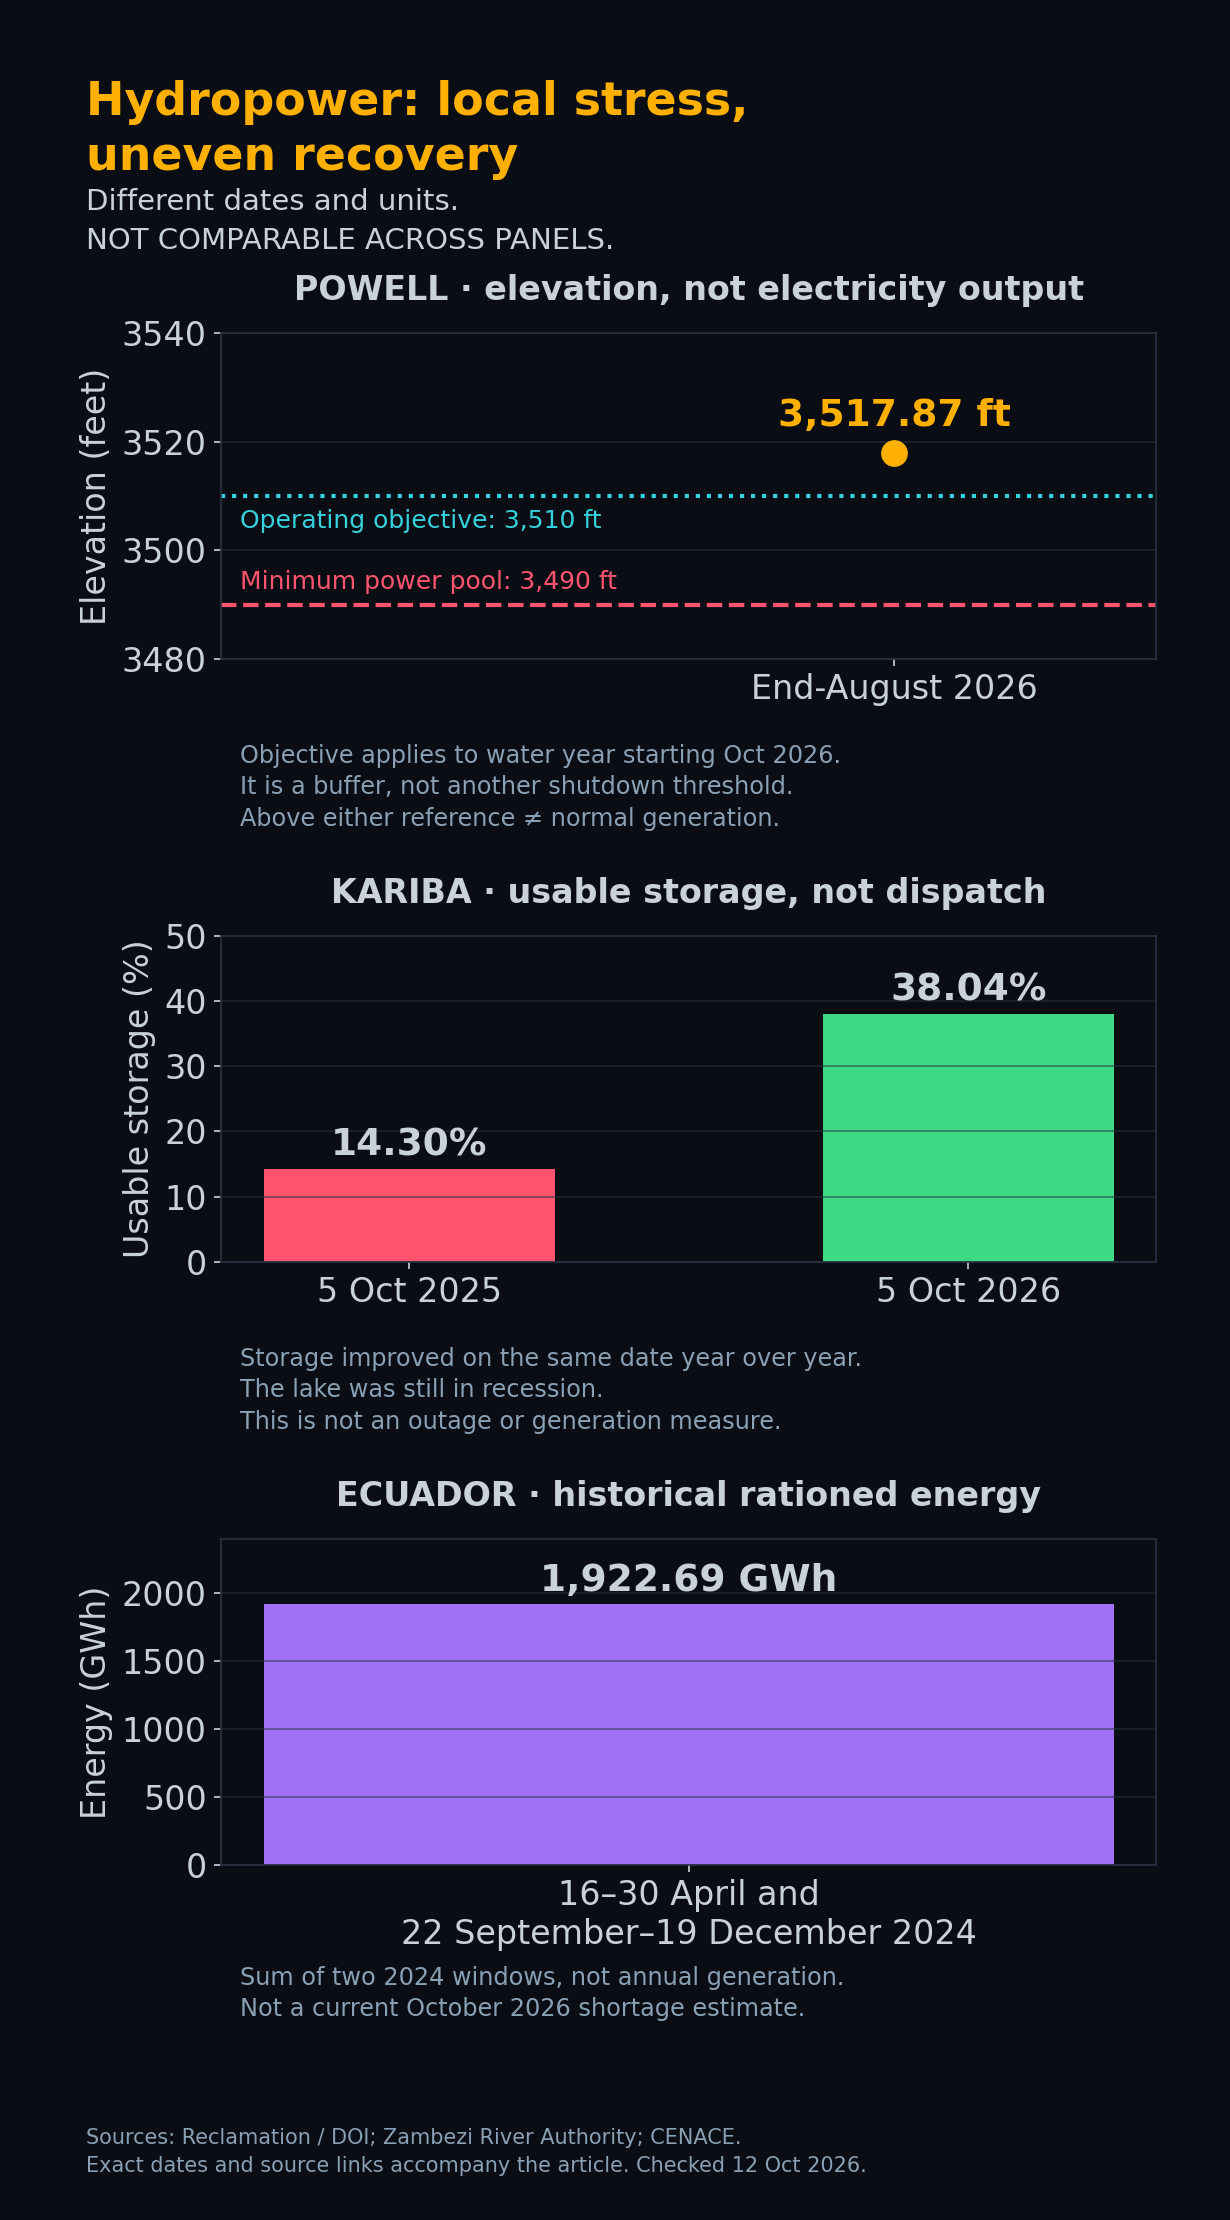
End-August observation. Reclamation subsequently reported an end-August Powell elevation of 3,517.87 feet and 5.14 maf, 22% of Reclamation’s live-storage capacity measure—a storage percentage, not a generation measure. The modeled below-3,490-foot outcome was not observed through August; that does not establish normal generation or remove future risk. Forecast/scenario, modeled risk, operating objective, and observed outcome are different evidence types. 7
Kariba: a severe event, followed by basin-specific recovery
11 March 2024 — historical load shedding. ZESCO’s 2024 Integrated Report records that it announced the commencement of 8-hour daily load shedding starting March 11, 2024, attributed to declining water levels. ZESCO supplies this historical operational record; it does not establish an October 2026 schedule. 8
5 October 2026 — later storage observation. The Zambezi River Authority reported 38.04% usable storage, versus 14.30% on the same date in 2025, while stating that the lake was in recession. This is a year-over-year usable-storage comparison, not a dispatch measure, total-reservoir-capacity percentage, or current outage schedule. 9
The chronology matters: a documented 2024 load-shedding event and a 2026 storage observation are different observations, not a continuous current crisis. Recovery in usable storage can limit the permanence of an investment story without disproving the physical mechanism. No current October 2026 ZESCO load-shedding schedule is established here.
Yunnan: the industrial transmission channel
A local power shortage can travel through an industrial supply chain when a basin hosts energy-intensive plants. In May 2024, Reuters reported a planned shift of 6.56 million tonnes per year of aluminium capacity—about 15% of China’s total—to Yunnan. Only a little over half had materialized. Eight employees at four smelters described production cuts of 10%–40%; that interview range was not a province-wide average. 10
Counterforce — 1 July 2024 and 5 October 2026. Reuters reported that improved rainfall and lifted restrictions enabled the restart of around 1.15 million tonnes per year of Yunnan capacity ordered offline in November 2023. China Weather Network later reported rain over most of Yunnan and forecast rain across most of the province for October 6–8, locally moderate to heavy. That is a rainfall observation/forecast, not a smelter-output, reservoir, or hydropower measurement. It is counterevidence against a permanent dry-year narrative, not proof of restored reservoirs or current smelter utilization. 11 12
The transmission channel remains conditional: electricity-intensive smelters can face lower utilization, delayed commissioning, or higher-cost replacement power when hydrology tightens. They can also delay, relocate, import power, use thermal generation, or draw inventories. The 2024 interruption is evidence of a transmission channel—not proof of a current shortage, a permanent global aluminium deficit, or an equity gain for copper producers.
Ecuador: rationing measured in energy
Observed — 2024. CENACE recorded 1,922.69 GWh of rationed energy during two windows—16–30 April and 22 September–19 December—after critical hydrological conditions at major hydro plants. This is observed rationed energy over those windows, not a full-year national total. 13
Company denominator — 2024. CELEC, Ecuador’s public electricity generator, reported that hydropower supplied 73.8% of its own 25,600 GWh of generation in 2024. These figures should not be divided or compared as if they shared a denominator: CENACE’s total covers the stated system windows, while CELEC’s 25,600 GWh is the generator’s own output denominator. 14
Modeled — 7 April 2026. A Nature Water study by Sterl and colleagues modeled coordinated hydro, solar, and wind operation in Ecuador. Its simulations found that resource complementarity could protect reservoir levels and cover much of a dry-year deficit while reducing thermal backup. This is modeled system performance—not proof that proposed capacity is built or that backup becomes unnecessary. 15
Counterforce — 2025. CENACE’s later annual report describes improved 2025 hydrology and electricity imports. It does not establish a current October 2026 reservoir level or national rationing total. The 2024 crisis is a documented case, not a claim that the same crisis is happening now. 16
Forward-looking planning signal — 7 October 2026. The IEA commentary says forecasts point to below-average rainfall across parts of northern South America as El Niño develops. This is not an observed shortage, a claim that Ecuador is currently rationing electricity, a deterministic El Niño impact, or a forecast of listed-company profits. Its response menu—tested emergency procedures, deliverable imports, demand response, diversified generation, and stronger interconnections—is preparedness guidance, not evidence that current contracts or tests exist. 1
What can keep the lights on?
The IEA’s broader resilience material describes tailored combinations of operating rules, reservoir and turbine changes, storage and flexibility, diversified generation, monitoring, and emergency response. Each measure has a different reliability function:
- Operating rules and reservoir/turbine changes can protect seasonal water and adapt equipment to changing conditions; they do not create inflows.
- Storage and flexibility can shift energy or respond over different durations. A battery is not, by itself, seasonal primary energy.
- Imports and interconnections help only when transfer capability and counterparties can deliver during stressed hours; an intertie label alone is not a delivered megawatt.
- Demand response is meaningful only when enrolled, measured, tested, and available for a defined duration, with notification and rebound assumptions understood. The IEA commentary does not establish those current program details here.
- Diversified or thermal generation can substitute in some conditions, but fuel, cost, environmental, ramping, outage, and construction-lead-time constraints remain.
The relevant scenarios are also different. A single-season shortfall, a multi-year drought, and a recovery year require different tests of fuel and import contracts, transmission deliverability, demand-response persistence, storage duration, financing, construction lead times, and carrying costs. These measures can reduce reliability exposure or shift it across time, geography, cost, emissions, and fuel dependence; they cannot guarantee elimination of a dry-year deficit. 3 4
Not comparable across panels. Powell shows elevation, not MW/GWh; Kariba shows usable storage, not dispatch; Ecuador shows the sum of two 2024 rationing windows, not annual generation. The systems, units, and periods differ. The chart is not a common-scale severity ranking or synchronized trend. Storage is not generation. The 3,510-foot operating objective and 3,490-foot minimum power pool are separate references, not two shutdown levels. 7 6 9 13
From water stress to a business case
The bear case comes first: a drought can be real while a security is the wrong expression, already priced, delayed, low-margin, diluted by unrelated businesses, or harmed by the same event. The physical mechanism is not an equity outcome.
A commercial claim would need five gates: (1) payer and budget; (2) issuer-level materiality after other businesses; (3) an awarded or clearly addressable contract and execution path; (4) recovery, substitution, delay, and margin/cash-flow sensitivity; and (5) conservative downside and valuation/margin-of-safety work. This article has not completed those gates. The securities below are examples whose conditional channels were examined—not attractive prices, expected winners, suitable holdings, or demonstrated solution exposure.
Not investment advice. Listing a symbol means only that a conditional mechanism was examined. It does not mean the security is attractive, suitable, liquid enough, fairly valued, or expected to benefit. No recommendation, allocation, price target, suitability, valuation clearance, or expected-return finding is made.
Issuer-level limits
FCX — mixed-direction copper context. Freeport’s latest checked quarterly filing covers June 2026 and identifies secure-water and climate risks. Its 2 October 2026 operational update reported lower-than-planned U.S. rates from flooding, power outages, and strong winds, while dry weather challenged Indonesian milling. This is direct evidence that a producer can be harmed by water and power stress—not evidence that Yunnan’s aluminium disruption benefits copper or FCX. 17 18
SCCO — mixed-direction copper context. Southern Copper’s mines and processing facilities are in Peru and Mexico. Its 2025 filing put fuel, gas, and power at approximately 26% of production costs and warned of energy and water-right risks. It also reported sufficient operating water supplies at the time. These are real exposures, not a verified current hydropower outage or an aluminium-to-copper profit channel. 19
FIW — diversified equity ETF, not a direct water-rights, reservoir, or hydropower instrument. FIW tracks the ISE Clean Edge Water Index. Its checked 9 October 2026 holdings comprised 36 securities, with 40.64% in the top ten (sum of displayed sponsor weights). The sponsor reported a 0.50% net annual expense ratio. Treatment, testing, and infrastructure can capture spending, but conservation, regulated utility volumes, financing, and a mixed portfolio can work against the theme. Shares can trade away from net asset value, and stressed spreads can widen. 20 21 22 23
GRID — broad grid-resilience exposure, not a direct claim on grid projects or hydro-restoration contracts. Its mandate covers grid equipment, networks, storage, and enabling technology—not a dedicated hydro-restoration allocation. The checked sponsor snapshot dated 18 September 2026 listed 123 holdings; the top ten summed to 57.48%. The disclosed net annual expense ratio was 0.56%, dated 2 February 2026. Broad electrification demand, concentrated holdings, overseas securities, and currency risk can overwhelm the hydro channel. Neither a company’s name nor an ETF weight proves hydro-related revenue. 24 25 26 27
GEV — hydro exposure is measurable but not a standalone equity thesis. GE Vernova reported $806 million of Hydro Power revenue within Power, against $38,068 million of total company revenue in 2025—about 2.1%, calculated on the same annual basis. That revenue share does not establish Hydro Power profit, cash flow, backlog quality, or valuation share. Hydro is a sub-business, not a standalone reporting segment. 28
Its May 2026 order for Upper Sileru pumped-storage equipment illustrates a supplier channel, with project completion expected in 2030. An order or project capacity is not recognized revenue. Pumped storage shifts energy supplied from elsewhere; it does not manufacture missing seasonal water or energy. Contract execution, margins, financing, timing, and the price already paid for the wider company still matter. 29 30
NQH2O is not a stock or ETF. NQH2O is a Nasdaq index tracking the spot-rate price of California water-rights transactions; it is not itself a security or a water-right ownership claim. CME separately lists NQH2O futures: financially settled contracts whose final settlement is the index value, with no physical delivery described in the product terms. A reader should not be told that “NQH2O” is a stock or ETF ticker that can simply be bought. 31 32
The defensible conclusion is narrower than a list of drought winners: hydropower stress can create potential demand for basin-specific resilience spending, but spending must be funded, procured, contracted, delivered, and profitable. Whether a named issuer captures it depends on payer, award, qualification, permitting/interconnection, manufacturing or construction lead time, execution economics, and issuer materiality. Copper producers can lose output; utilities can lose generation; equipment suppliers can face delayed budgets and cost inflation; broad ETFs dilute the mechanism. Resilience tools can be counterforces without being investable advantages.
Historical price context—not a hydropower payoff
Context only: split-adjusted price returns, not total returns, attribution, a hydropower backtest, a signal, a ranking, or a forecast.
| Security | Price gain* | Maximum price drawdown* | Exposure limit |
|---|---|---|---|
| FCX | +105.7% | -51.7% | Copper context; water/power shocks can hurt its operations. |
| SCCO | +280.0% | -45.2% | Copper context; not a demonstrated hydropower beneficiary. |
| FIW | +22.4% | -28.7% | Diversified water equities; not water rights, a reservoir, or hydro ownership. |
| GRID | +90.1% | -30.4% | Broad grid equities; unrelated drivers dominate parts of the basket. |
| SPY | +78.9% | -25.4% | Broad-market benchmark; not a hydro expression. |
*Actual common trading window returned by the vendor: 13 October 2021–9 October 2026. The requested 11 October start returned no bars and was not forward-filled. Massive/Polygon split-adjusted daily closes, USD; cash dividends are not reinvested, so these are price returns, not total returns. Drawdown is the worst closing-price decline from a prior closing peak. No transaction costs or taxes are included. USD price returns do not isolate hydrology, commodity prices, the wider market, interest rates or exchange rates. Historical returns do not establish causation or predict future performance. 33
GEV is a separate shorter-window observation. Do not compare it with the longer-window group above.
| Security | Window | Price gain* | Maximum price drawdown* |
|---|---|---|---|
| GEV | 2 April 2024–9 October 2026 | +617.7% | -38.3% |
| SPY — same dates | 2 April 2024–9 October 2026 | +50.1% | -19.0% |
*Same split-adjusted price-only method. The GEV figure is a historical price-only observation for the wider company, not a hydro-return estimate; no attribution of that move to Hydro Power is made. The shorter-window gain is not directly comparable with the longer-window figures. FIW lagged SPY on the common price-only window; no claim is made about dividend-inclusive relative performance or what drove any stock’s return. 33
What would break the thesis?
The case for a persistent basin-level constraint weakens if inflows and operating margins recover, hydro availability and dispatch remain stable, industrial curtailment does not occur, or replacement energy and capacity arrive without material reliability effects. These tests must be applied basin by basin; recovery after replenishing inflows is evidence against permanence, not necessarily against the local mechanism.
The investable claim weakens if the chain does not produce a payer, funded budget, awarded or addressable work, issuer-level revenue or cash-flow materiality, durable margins, or a valuation response after delays and substitutions. Repeated recovery without durable capex, contract capture, issuer earnings impact, or valuation re-rating is evidence against the opportunity even if the hydrology-to-availability mechanism recurs. Both physical and investable claims need observable evidence; neither is made unfalsifiable by saying that every outcome is compatible with the thesis.
A plain-English monitoring checklist is therefore: Are basin inflows, elevation/live storage, operating rules, available MW, seasonal MWh/GWh, dispatch, rationing, and industrial utilization changing? Then, separately, is there a named payer, funded project, award, delivery date, recognized revenue, material profit/cash-flow effect, or disclosed substitution risk at the issuer? Those are research questions, not trade instructions.
Physical hydrology sets the boundary; institutions decide how the constraint is allocated, mitigated, and paid for. The market outcome depends on who controls the bottleneck, who absorbs the cost, how quickly hydrology recovers, what substitutes arrive, and what investors already paid for the story.
References
- IEA, How electricity systems across Latin America can strengthen preparedness for El Niño (7 Oct 2026; forecasts and preparedness)
- U.S. Bureau of Reclamation, ‘Enhancing Hoover Dam’s Infrastructure and Energy Reliability’ (21 May 2026)
- International Energy Agency, ‘Climate Impacts on Latin American Hydropower — Measures to enhance resilience’ (29 Jan 2021)
- International Energy Agency, ‘Power Systems in Transition — Climate resilience’ (1 Jun 2020)
- U.S. Bureau of Reclamation, ‘Reclamation Acts to Protect Colorado River System During Historic Drought’ (17 Apr 2026)
- U.S. Department of the Interior, Colorado River operating guidelines announcement (21 Aug 2026; original dated page)
- U.S. Bureau of Reclamation, ‘Glen Canyon Dam | Water Operations’ (page updated 15 Sep 2026; accessed 12 Oct 2026)
- ZESCO Limited, 2024 Integrated Report (historical load-shedding record)
- Zambezi River Authority, ‘Lake Kariba Weekly Levels in Meters’ (access-date-only live page; accessed 12 Oct 2026)
- Reuters, ‘China’s green aluminium ambitions hit by erratic rains and power cuts’ (10 May 2024)
- Reuters, ‘Rising Chinese aluminium output pressures alumina supply’ (1 Jul 2024)
- China Weather Network, ‘Rain continues across much of Yunnan; some areas may see moderate to heavy rain’ (5 Oct 2026; accessed 12 Oct 2026)
- CENACE, ‘Informe Anual CENACE 2024’ (11 Apr 2025)
- CELEC EP, ‘PATH-Aligned Decarbonisation Plan for CELEC’ (2025)
- Sterl, Pineda, Mast, Rodríguez, Muñoz and Thiery, ‘Variable renewables fortify Ecuador’s power system against recurrences of drought-driven energy crises,’ Nature Water (7 Apr 2026)
- CENACE, ‘Informe Anual CENACE 2025, Parte 2’ (31 Mar 2026)
- Freeport-McMoRan Inc., Form 10-Q for quarter ended 30 Jun 2026 (filed 6 Aug 2026)
- Freeport-McMoRan Inc., ‘Freeport Provides Third-Quarter 2026 Operational Update’ (2 Oct 2026)
- Southern Copper Corporation, Form 10-K for year ended 31 Dec 2025 (filed 27 Feb 2026)
- First Trust, FIW official fund summary (access-date-only page; data as of 16 Sep 2026)
- First Trust, FIW official holdings (access-date-only page; holdings as of 9 Oct 2026)
- Nasdaq, ISE Clean Edge Water Index (access-date-only overview; accessed 12 Oct 2026)
- First Trust Exchange-Traded Fund Trust Prospectus (13 Aug 2026)
- First Trust, GRID official product page (access-date-only page; fund data dated 18 Sep 2026)
- First Trust, GRID official holdings (access-date-only page; snapshot dated 18 Sep 2026)
- Nasdaq, NASDAQ OMX Clean Edge Smart Grid Infrastructure Index (access-date-only overview; accessed 12 Oct 2026)
- Clean Edge, QGRD overview and methodology (access-date-only page; accessed 12 Oct 2026)
- GE Vernova Inc., 2025 Form 10-K (filed 12 Feb 2026)
- GE Vernova Inc., Form 10-Q for quarter ended 30 Jun 2026 (filed 22 Jul 2026)
- GE Vernova, ‘GE Vernova to deliver pumped-storage technology for Upper Sileru hydropower project in India’ (4 May 2026)
- Nasdaq, ‘The Nasdaq Veles California Water Index’ (access-date-only overview; accessed 12 Oct 2026)
- CME Group, ‘Nasdaq Veles California Water Index futures — Frequently Asked Questions’ (7 Dec 2020)
- Massive, aggregate bars are split-adjusted, not dividend-adjusted (accessed 12 Oct 2026; price series retrieved privately through 9 Oct 2026)
Found this useful? AtomProphet is independent and reader-funded — you can support the research & hosting ↓
Get the next cascade in your inbox
One short email when a new analysis drops — a single constraint traced end to end, from the physics to the chokepoint to the tickers, with the honest bear case kept in view. No marketing, no tracking, no noise.
- One email per published analysis — typically a few a month, never a daily blast
- The full cascade: driver → chokepoint → vetted, live-liquidity tickers
- The counter-case spelled out, not buried
No account, no paywall. Double opt-in, and one-click unsubscribe in every email.
Support the research & hosting
AtomProphet is independent, ad-light, and reader-funded. Contributions help cover data feeds, hosting, and the time behind the Cascade Graph — they keep this research free and open. A tip buys nothing, unlocks nothing, and is not payment for advice or for any security mentioned anywhere on this site.
Bitcoin37h98hpiHz6BW6ELvRLagk7BBo8UUtxeSh USDC · Base 0x1ac1Abe9eCAd5fAd8fF55B188E079b52cD1e6415